|
Funded by the National Science Foundation: Award #1923986
Collaborating Universities: UMBC, Towson University, Bowie State University, University of Baltimore
Status: Current
Students at BSU
Current Students:
- Tyren Walker (Undergraduate Student)
- Sean Walker (Undergraduate Student)
- Taylor Brown (Undergraduate Student)
- Brianna Young (Undergraduate Student)
- Joevaughn Findlay (Undergraduate Student)
Past Students:
- Andrei Carillo (Undergraduate Student)
- Deiondrea Berry (Undergraduate Student)
- Adrian Brown (Undergraduate Student)
- Justin Taylor (Undergraduate Student)
- Sri Teja Bodempudi (Doctoral Student)
- Suraj Chilaka (Doctoral Student)
- Trisha Rayan, (High School Student, TJHSST: Thomas Jefferson HS for Science Technology)
The goal of this project is to develop a team-based data science corps program for undergraduate students from Computer Science, Information Systems, and Business integrating both academic training as well as hands-on experience through real-world data science projects. This project is a collaborative effort with the University of Maryland Baltimore County as the coordinating as well as an implementing organization, and the University of Baltimore, Towson University, and Bowie State University as implementing organizations. This project focuses on the city of Baltimore as an exemplar for other cities in the US and across the globe. The project team will collaborate with a number of communities in the city of Baltimore to integrate real-world data science projects into classroom instruction in data science. The specific objectives of this project are as follows: (i) Develop the technical, analytical, modeling, and critical thinking skills that are key to success as a data science professional; (ii) Connect a cohort of students to communities, organizations, and projects that can benefit from the power of data science; (iii) Nurture and support innovative thinking in solving some of the key challenges facing the real world; (iv) Promote a better understanding of the power and pitfalls of data-driven discoveries to improve the quality of life in urban communities; (v) Increase the data science workforce capacity to support this critical area that is of growing importance in society; and finally, (vi) Evaluate the effect of the proposed data science corps on student learning.
This project will create a core set of knowledge that will be valuable in developing solutions for real-world urban settings with the understanding that not all projects will require the application or use of every topic covered in the data science corps program. The core set of knowledge includes data collection and cleaning, data analysis using machine learning and deep learning techniques, data visualization including geospatial data and virtual reality, data privacy and security, and infrastructure for smart cities including IoT-based sensor networks. The proposed data science corps program will have two main phases: instructional phase (10 modules in total) and real-world team projects (5 modules in total). The project teams consist of students who have taken a course in at least one of the following areas: data collection and analysis, big data, machine learning including deep learning, smart cities, cybersecurity, geospatial data analysis and visualization, and virtual reality.
Real World Projects at BSU
| |
Scientific Data Visualization of COVID-19 Data and Baltimore Crime Data |
 |
The goal of this project is to find common links between COVID-19 data and its relationships with crime data in Baltimore.The aim of the project is to develop scientific data visualization using Paraview, Power BI, DXR, and Unity 3D. Advances in new technologies such as machine learning, virtual reality, augmented reality, and mixed reality have given rise to immersive field of immersive analytics, which investigates how these new technologies support analysis and decision making. We are exploring data sets for location information of crimes that have occurred in Baltimore City dating back to 2012. Human-centric situational awareness and immersive analytics are needed for analyzing the big data in an efficient way. The project aims to use virtual reality, augmented reality, and mixed reality techniques to visualize the data. |
| |
|
| |
Data Visualization, Analysis and Prediction of Crime and COVID Data |
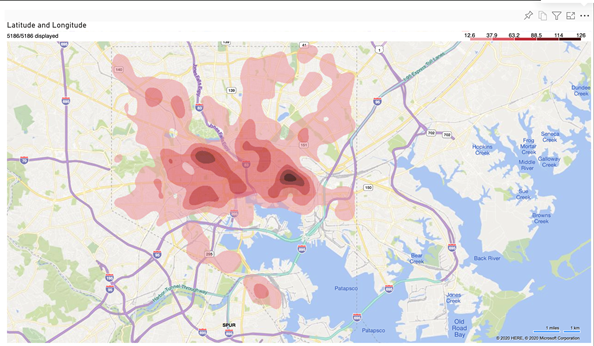 |
The goal of this project is to find out reasons as to why the black community is disproportionally impacted during the coronavirus pandemic, compare the COVID-19 data with past recent events for spike in data, time series analysis, and other types of data in Baltimore, such as real estate and school closings. It is found that the higher death rate of African Americans during the COVID-19 pandemic is significantly influenced by factors such as living in more crowded housing situations, working in consumer-facing serviced industries, having higher rates of existing medical conditions such as high blood pressure, diabetes, obesity, asthma, and heart, liver and kidney diseases, lack of insurance or a consistent care source limits access to COVID-19 testing and treatment, and the prison system. |
| |
|
| |
Augmented Reality with Hololens: Building Evacuation |
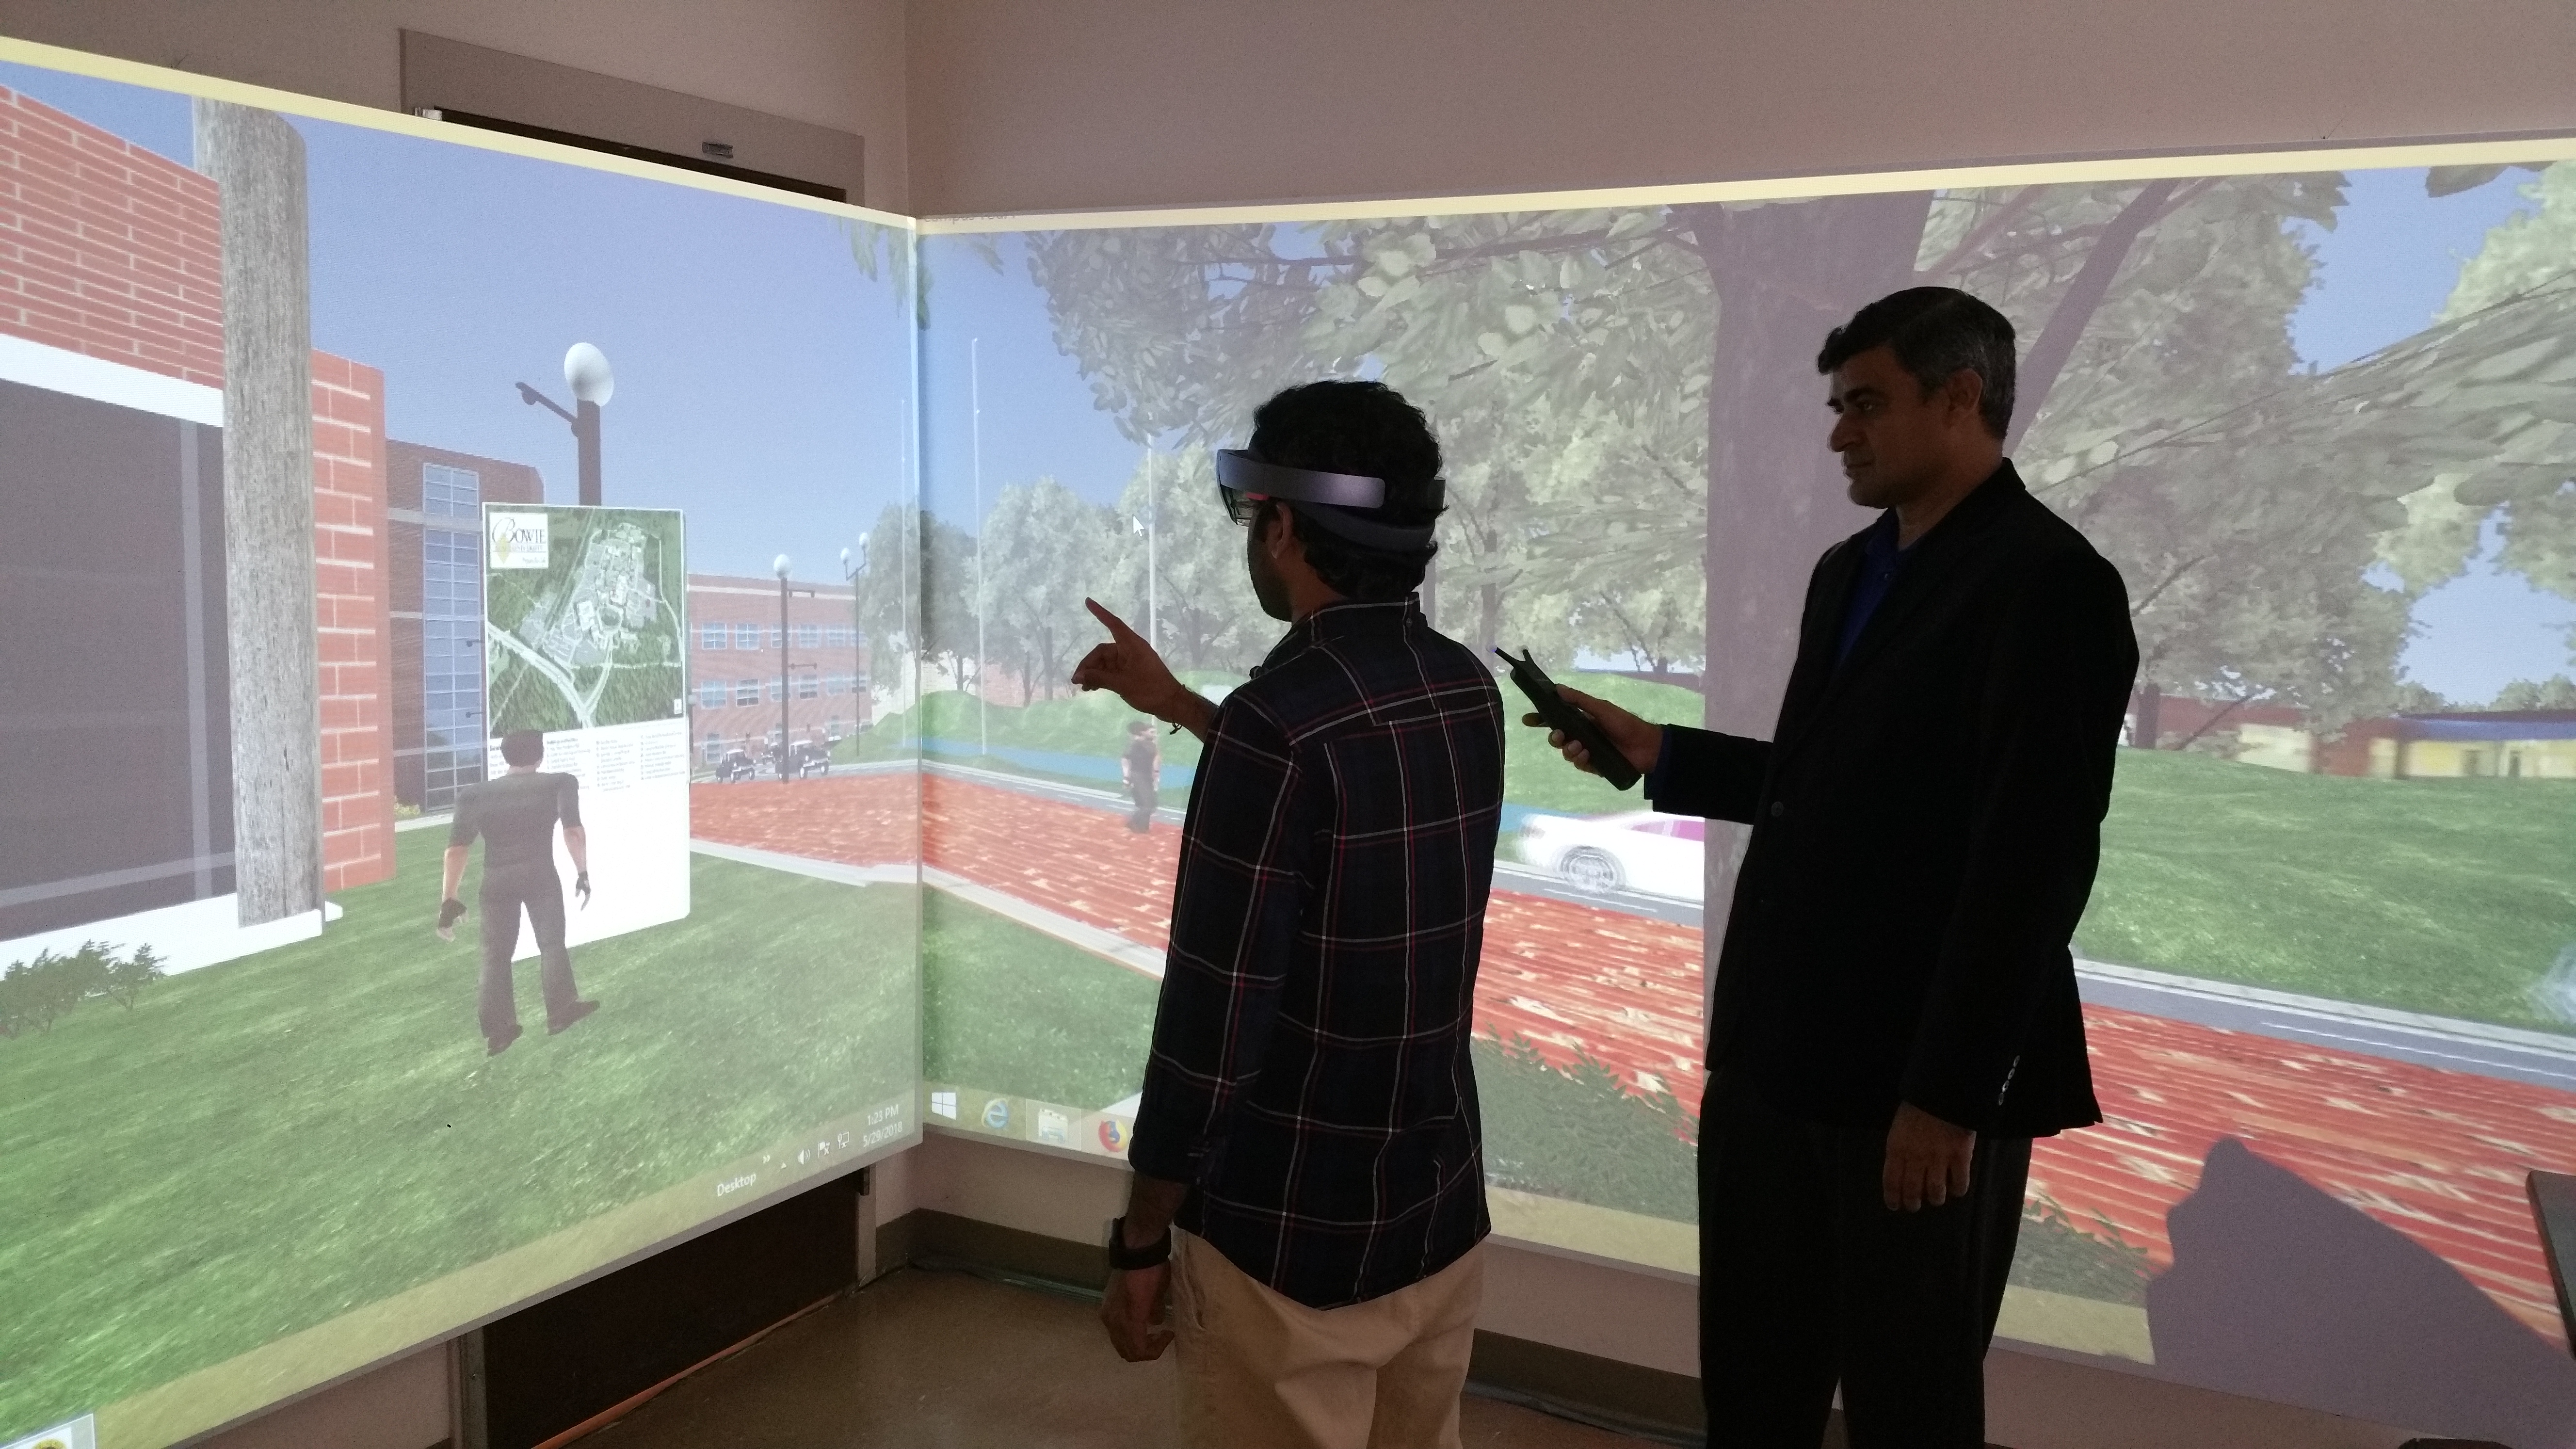 |
Early hands-on experiences with the Microsoft Hololens augmented/mixed reality device have given promising results for building evacuation application. A range of use cases are tested, including data visualization and immersive data spaces, in-situ visualization of 3D models and full scale architectural form visualization. The Hololens is a remarkable tool for moving from traditional visualization of 3D objects on a 2D screen, to fully experiential 3D visualizations embedded in the real world. Our Hololens application gives a visual representation of a computer science building in 3D space, allowing people to see where exits are in the building. It also gives path to the various exits; shortest path to the exist as well as directions to safe zone. |
| |
|
| |
Virtual Reality Instructional (VRI) modules for Data Science |
 |
The aim is to create instructional course curriculum modules with more inquiry based problem-solving activities and hand-on experiences based on Gaming and Virtual Reality. The Virtual Reality Instructional (VRI)/ Game Theme Instructional (GTI) modules endeavor to increase the students interest in learning data science and programming concepts. However, the VRI/GTI modules should be usable and likable to include it in a class curriculum. We have incorporated a virtual instructor to help the users learn in the modules. We have evaluated the GTI modules using Student Assessment of their Learning Gains (SALG), User Engagement Scale (UES), Theory of Reasoned Action (TRA), and Science Motivation Questionnaire (SMQII) to evaluate usability, likability, and motivation respectively. The result of evaluation shows that the modules are usable, likable, motivational, and engaging. |
| |
|
| |
|
Instructional Training Modules at BSU
- Virtual Reality and Data Visualization
- Compare COVID-19 Data to Baltimore Crime Data using Power BI: The goal of this module is to create a time series visualization and a bar chart to show relevant trends and relationships in COVID-19 Baltimore data and Crime Baltimore data using a powerful data visualization tool.
Project Personnel
- Aryya Gangopadhyay (Information Systems, University of Maryland Baltimore County)
- Jennifer Harrison (Faculty Development Center, University of Maryland Baltimore County)
- Linda Hodges (Faculty Development Center, University of Maryland Baltimore County)
- Anupam Joshi (Computer Science and Electrical Engineering, University of Maryland Baltimore County)
- Seema Iyer (Jacob France Institute , University of Baltimore)
- Michael P. McGuire (Computer and Information Sciences, Towson University)
- Tim Oates (Computer Science and Electrical Engineering, University of Maryland Baltimore County)
- Sanjay Purushotham (Information Systems, University of Maryland Baltimore County)
- Nirmalya Roy (Information Systems, University of Maryland Baltimore County)
- Sharad Sharma (Computer Science, Bowie State University)
Publications
- Rajeev,S., Sharma, S, "Evaluation of Game-Theme Based Instructional Modules for Data Structure Concepts", International Journal of Computers and their Applications, IJCA, Vol. 27, No. 1, pp.24-34, March 2020.
- Sharma, S, "Improving emergency response training and decision making using collaborative virtual reality environment for building evacuation", Proceedings of the 22nd International Conference on Human-Computer Interaction (HCI International 2020), Thematic Area: Virtual, Augmented and Mixed Reality, Copenhagen, Denmark, 19-24 July 2020.
- Sharma, S, Stigall, J., Bodempudi, S.T., "Situational awareness-based Augmented Reality Instructional (ARI) module for building evacuation", Proceedings of the 27th IEEE Conference on Virtual Reality and 3D User Interfaces Abstracts and Workshops (VRW), doi: 10.1109/VRW50115.2020.00020, Atlanta, GA, USA, pp. 70-78, 2020.
- Sharma, S., Bodempudi, S.T., "Identifying anomalous behavior in a building using HoloLens for emergency response", IS&T International Symposium on Electronic Imaging (EI 2020), in the Engineering Reality of Virtual Reality, Hyatt Regency San Francisco Airport, Burlingame, California, 26 January- 30 January 2020.
- Sharma, S., Bodempudi, S.T., "Active Shooter response training environment for a building evacuation in a collaborative virtual environment", IS&T International Symposium on Electronic Imaging (EI 2020), in the Engineering Reality of Virtual Reality, DOI: https://doi.org/10.2352/ISSN.2470-1173.2020.13.ERVR-223, 26- 30 Jan 2020.
- Sharma, S, Bodempudi, S.T., Arrolla, M., "Collaborative Virtual Assembly Environment for Product Design", Proceeding of the IEEE International Conference on Computational Science and Computational Intelligence (CSCI'19), Las Vegas, Nevada, USA, Dec 05-07, 2019.
- Bodempudi, S.T., Sharma, S, Sahu, A, "Human-Centric Situational Awareness and Big Data Visualization", Proceeding of 28th International Conference on Software Engineering and Data Engineering (SEDE 2019) in San Diego, CA, USA on September 30 - October 2, 2019.
Related Links
Related Papers
Unity 3D: Data Visualization
 VR LABORATORY (C) 2007-2021, ALL RIGHTS RESERVED
 |