Human Centric Cyber Situation Awarenessand Data Visualization in VR/AR
Current Students: Phillip Devreaux, Sri Teja
Status: Current
The goal of this project is to explore ways to visualize the Cyber Situational Awareness capability of an enterprise to the next level by developing holistic human centric situational awareness approaches into new systems that can achieve self-awareness. This research effort aims to identify how graphical objects (such as data-shapes) developed in accordance with an analyst's mental model can enhance analyst's situation awareness. A variety of computer and network security research topics belong to the scope of Cyber Situational Awareness. However, the Cyber Situational Awareness capability of an enterprise is still very limited due to:
Existing system designs are not very way to visualize Cyber Situational Awareness.
Lack of ways to visualize the threat/attack to develop ways to counterattack.
Limited capability to handle uncertainty.
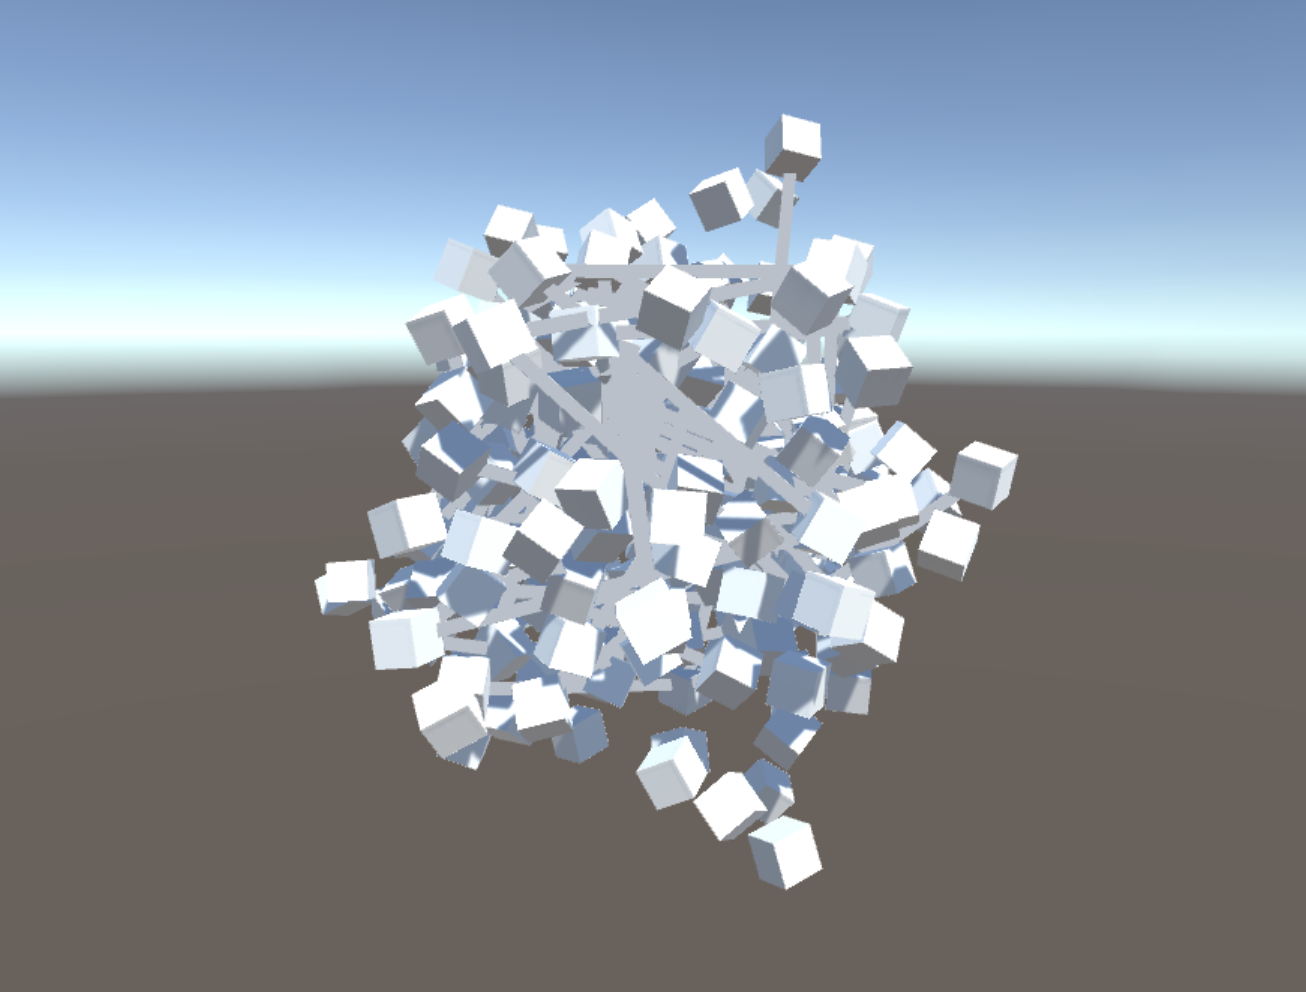
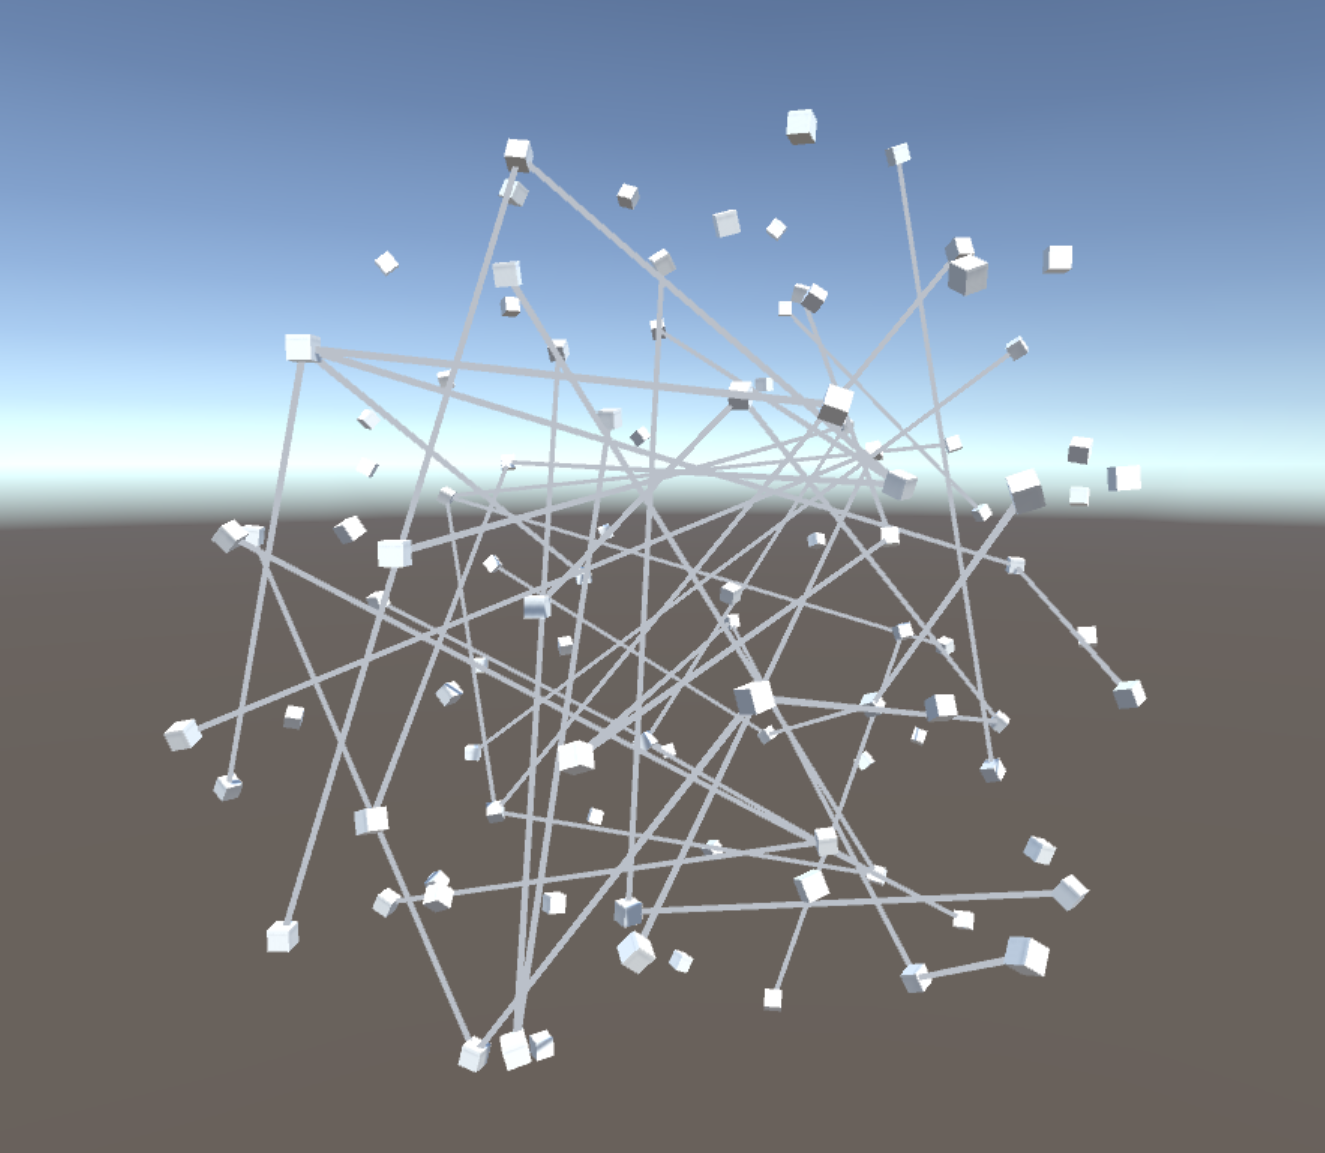
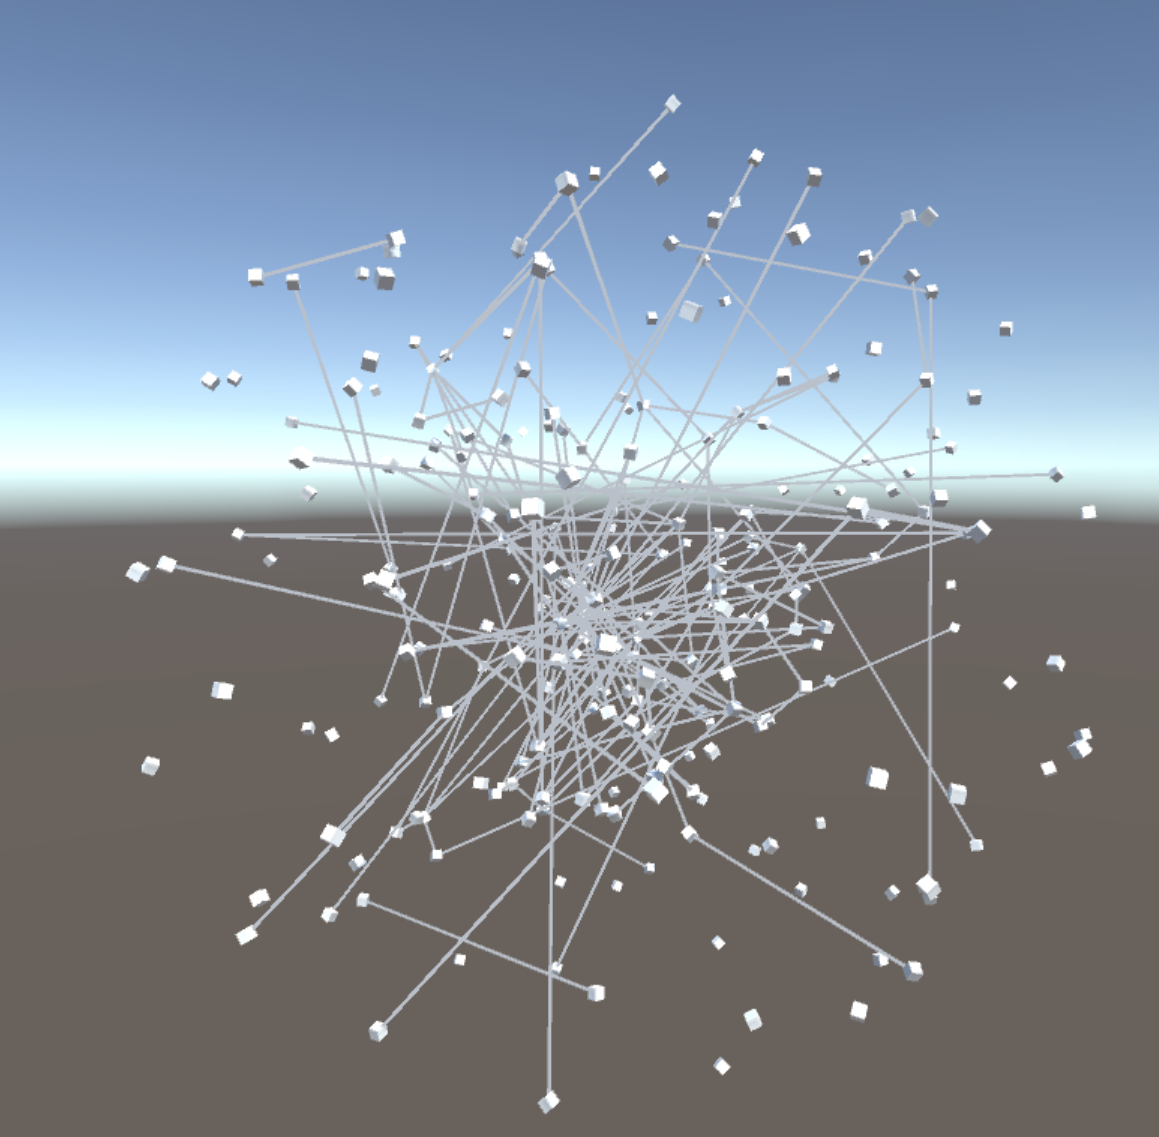
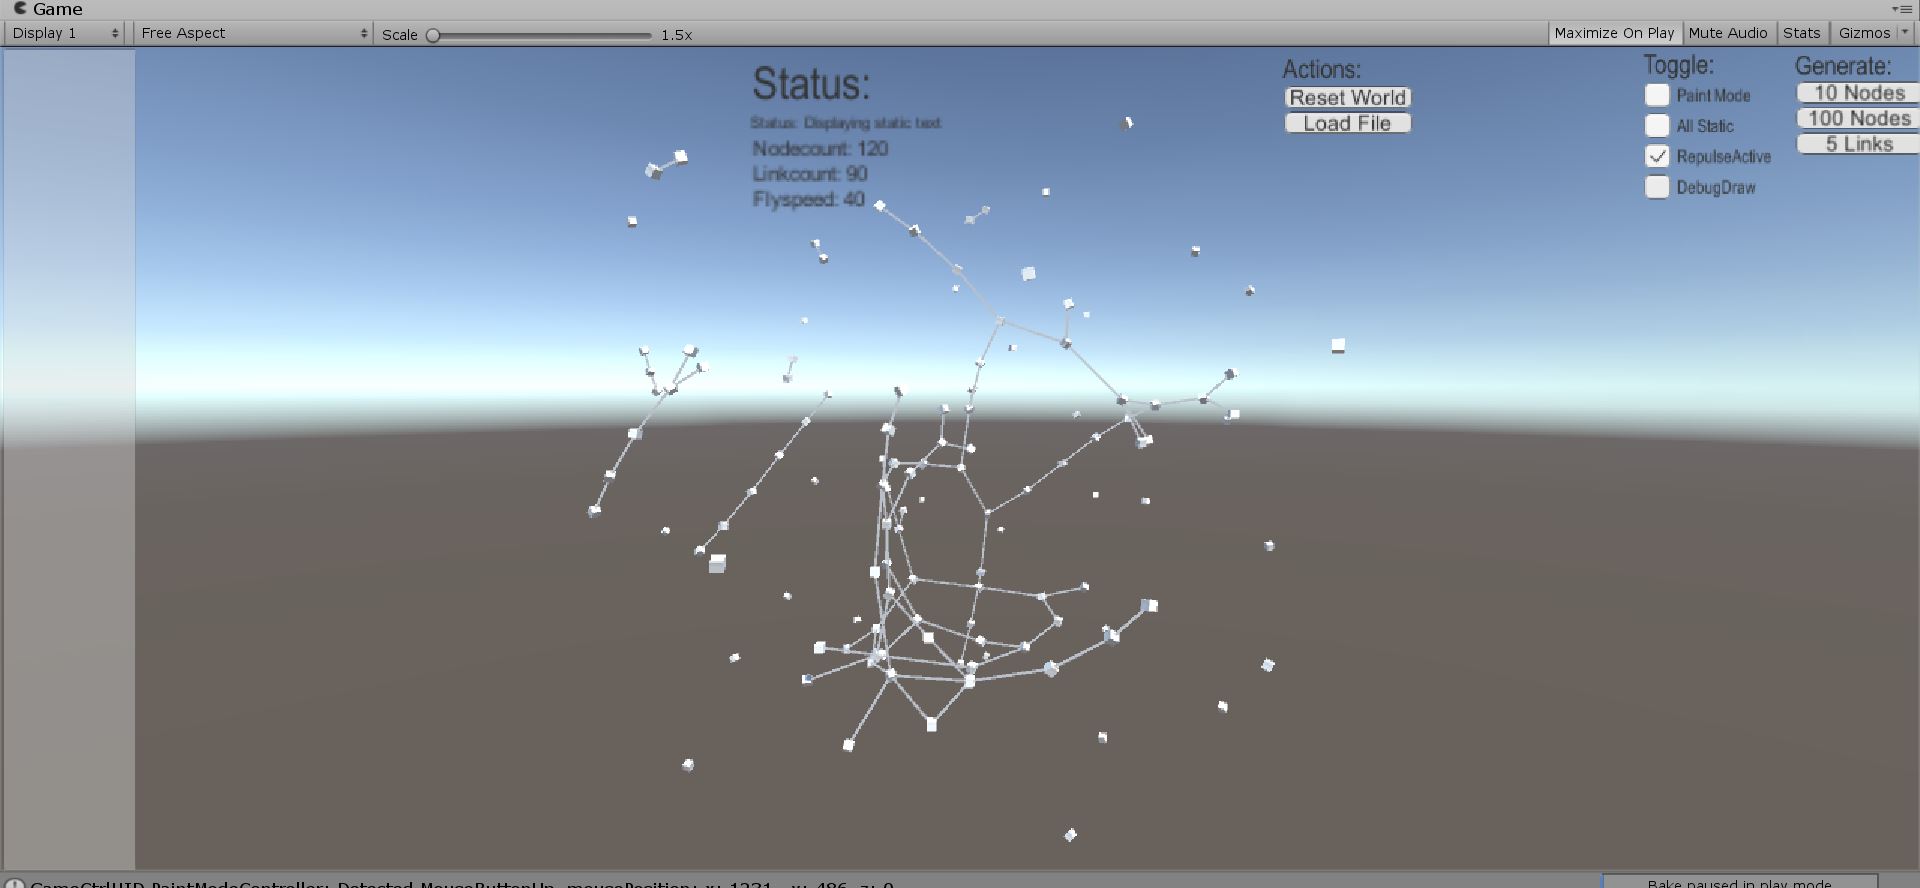
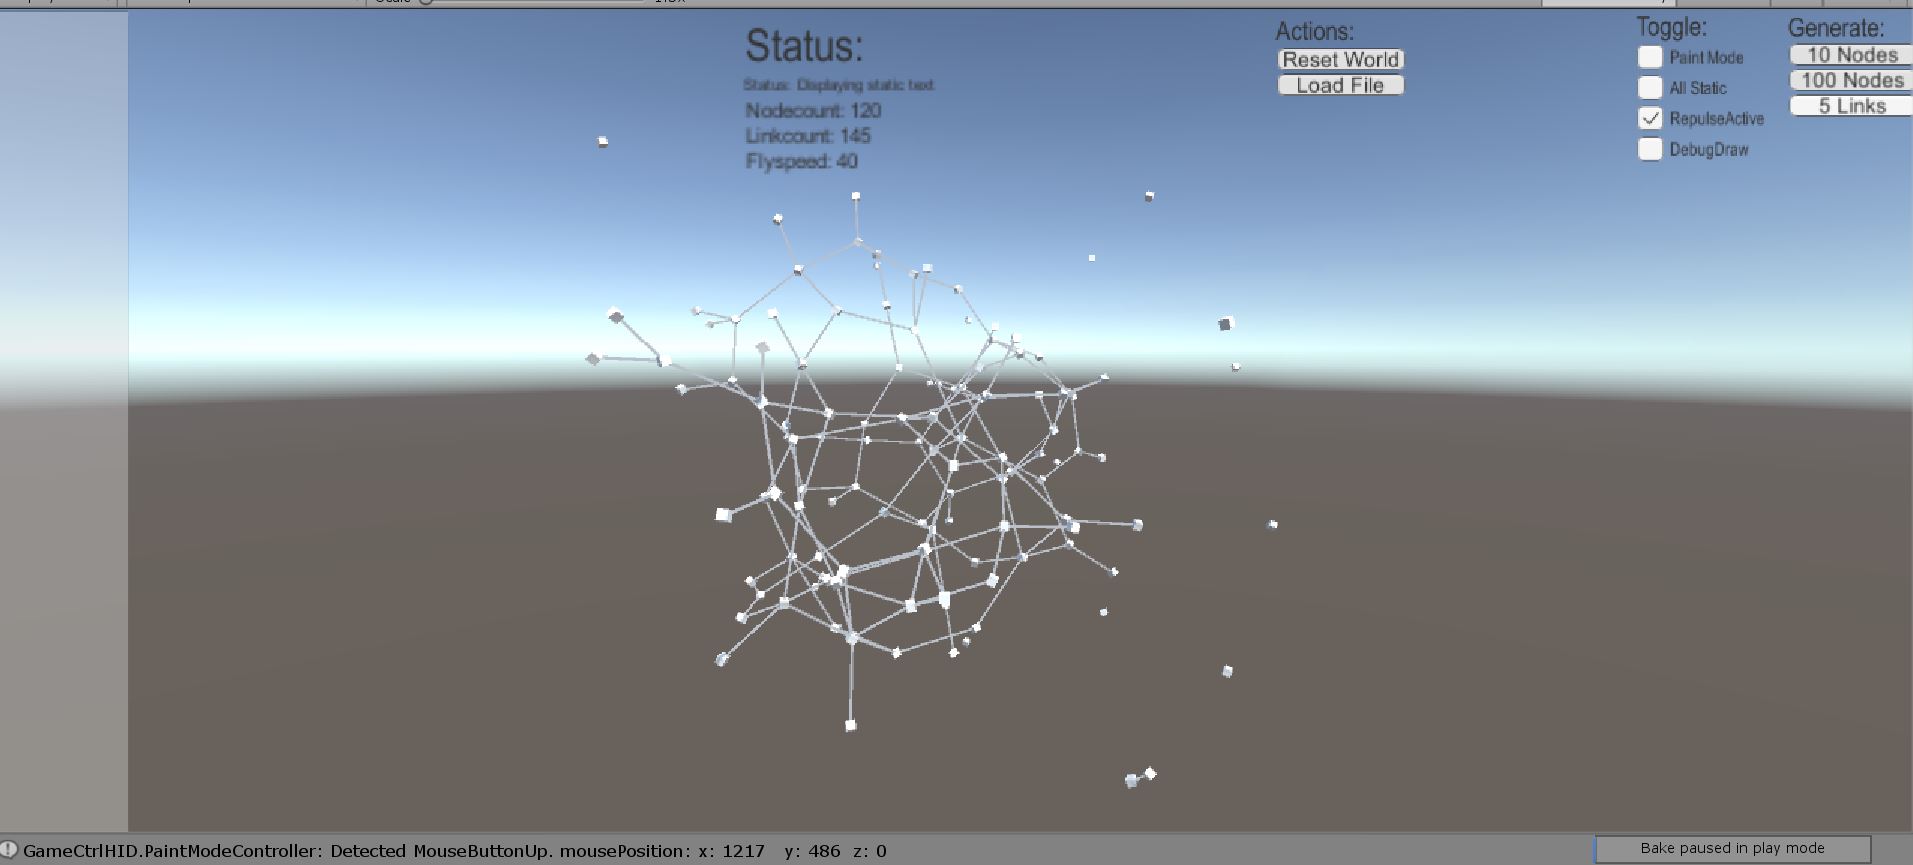
The humans are more adept at inferring meaning from graphical objects, links and associations in a data elements. The project aims to use virtual reality techniques to visualize the XML data through the use of a Force Directed Node Graph in 3D which renders and updates in real-time. It can be used to visualize computer networks for cyber-attacks. It is being created using Game engine Unity3D and available physics engines to draw the graph.Our current goal is to
1. Develop specialized visualization tools for exploring multivariate and high dimensional data sets in AR/VR
2. Develop data and graph reduction techniques that can be leveraged to distill data from input sources/sensors, incorporating information regarding sensor locations and types, which will be used with more goal-directed modeling and analyses.
3. Visualization tool to determine malicious code running on the sensors using oculus rift.
4. Deploy the visualization tool in Microsoft Hololens augmented/mixed reality device with voice commands
5. Compare call-graphs with multiple files by adding layers for text, color, etc. for in human-in-loop interface interaction.
The currently graph can render around 200 to 300 linked nodes in realtime.
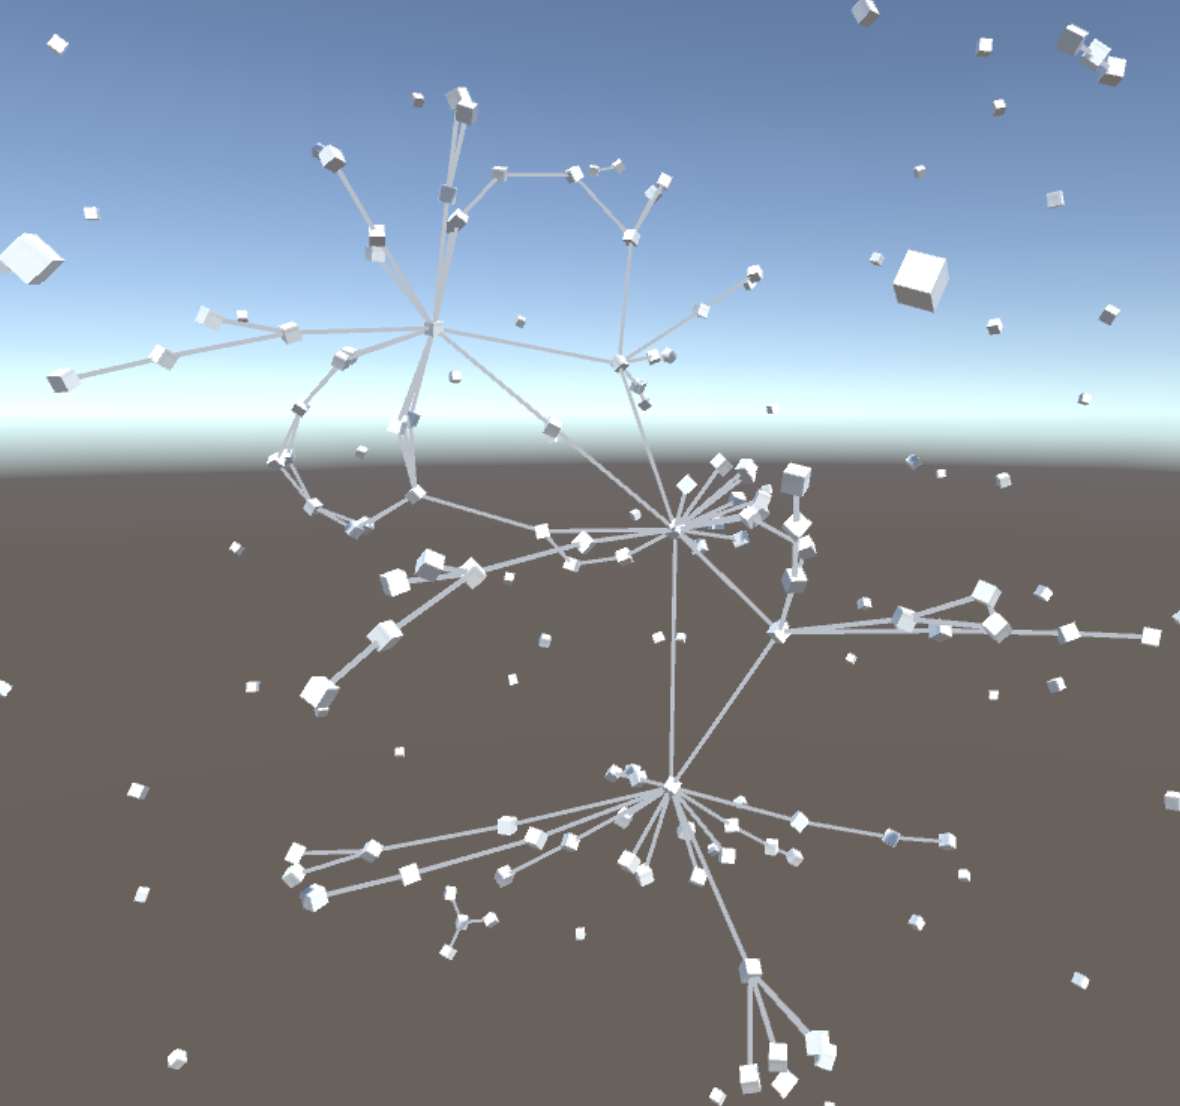
Data Visualization using Force directed graph (Non-Immersive VR)
Non-immersive visualization tool
Non-immersive visualization tool
Relationships in data
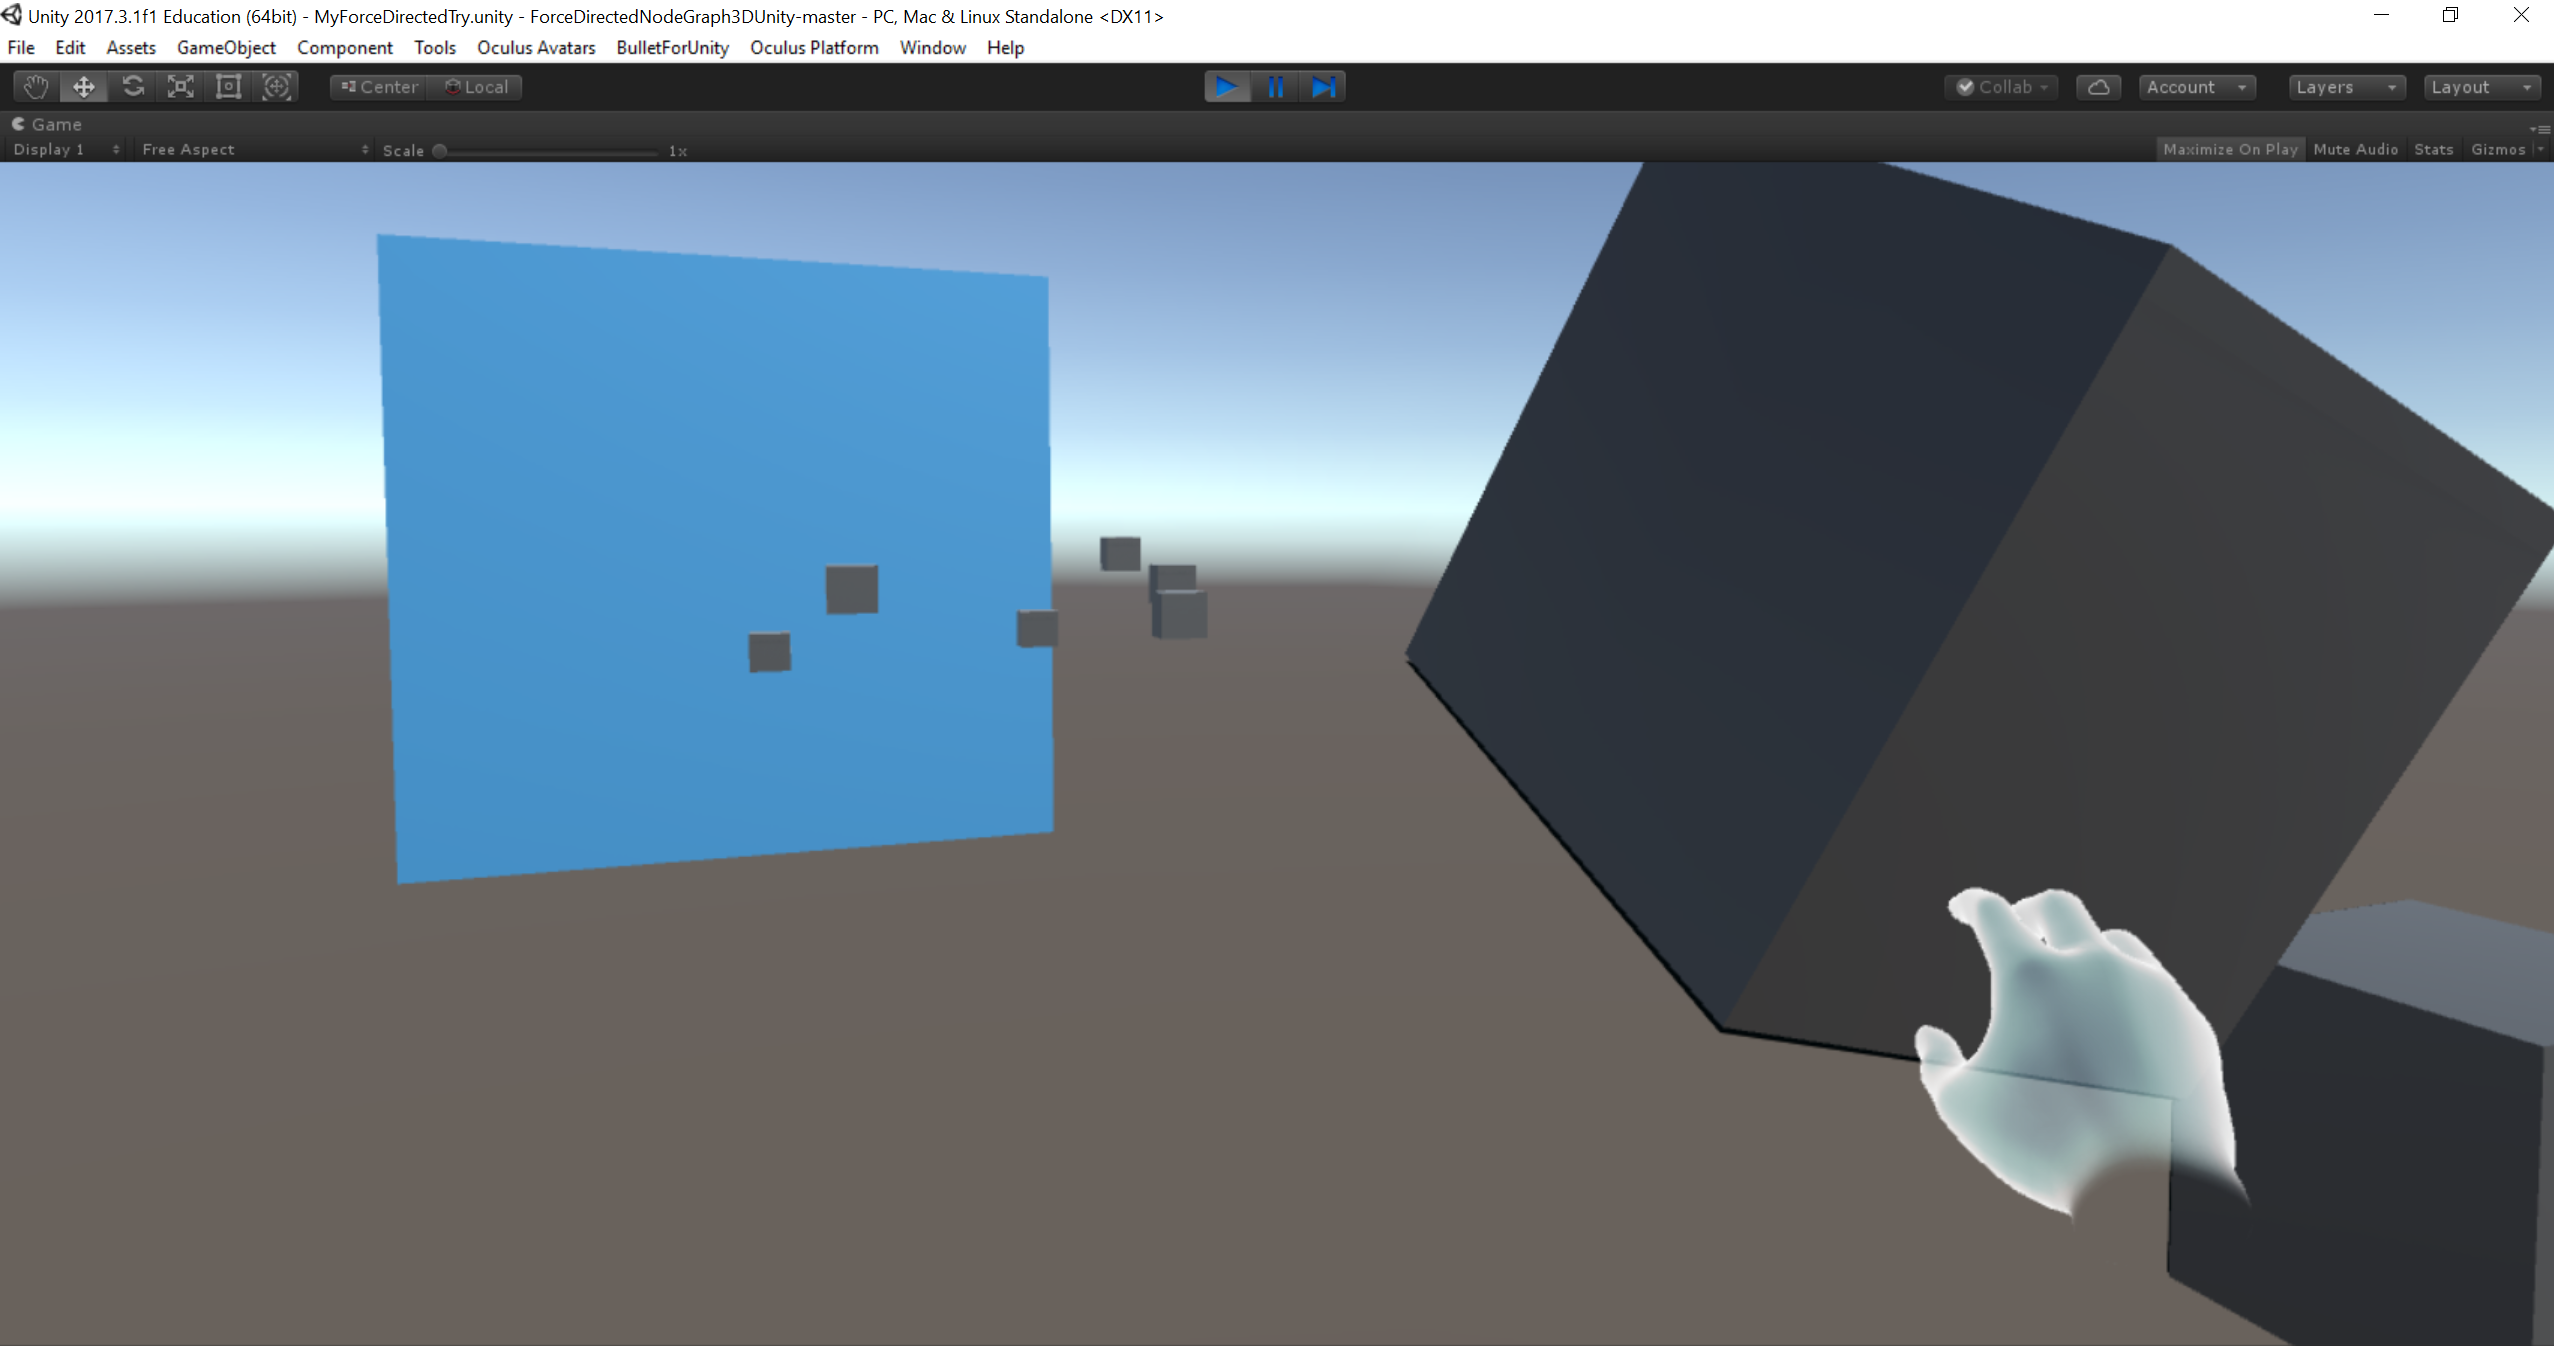
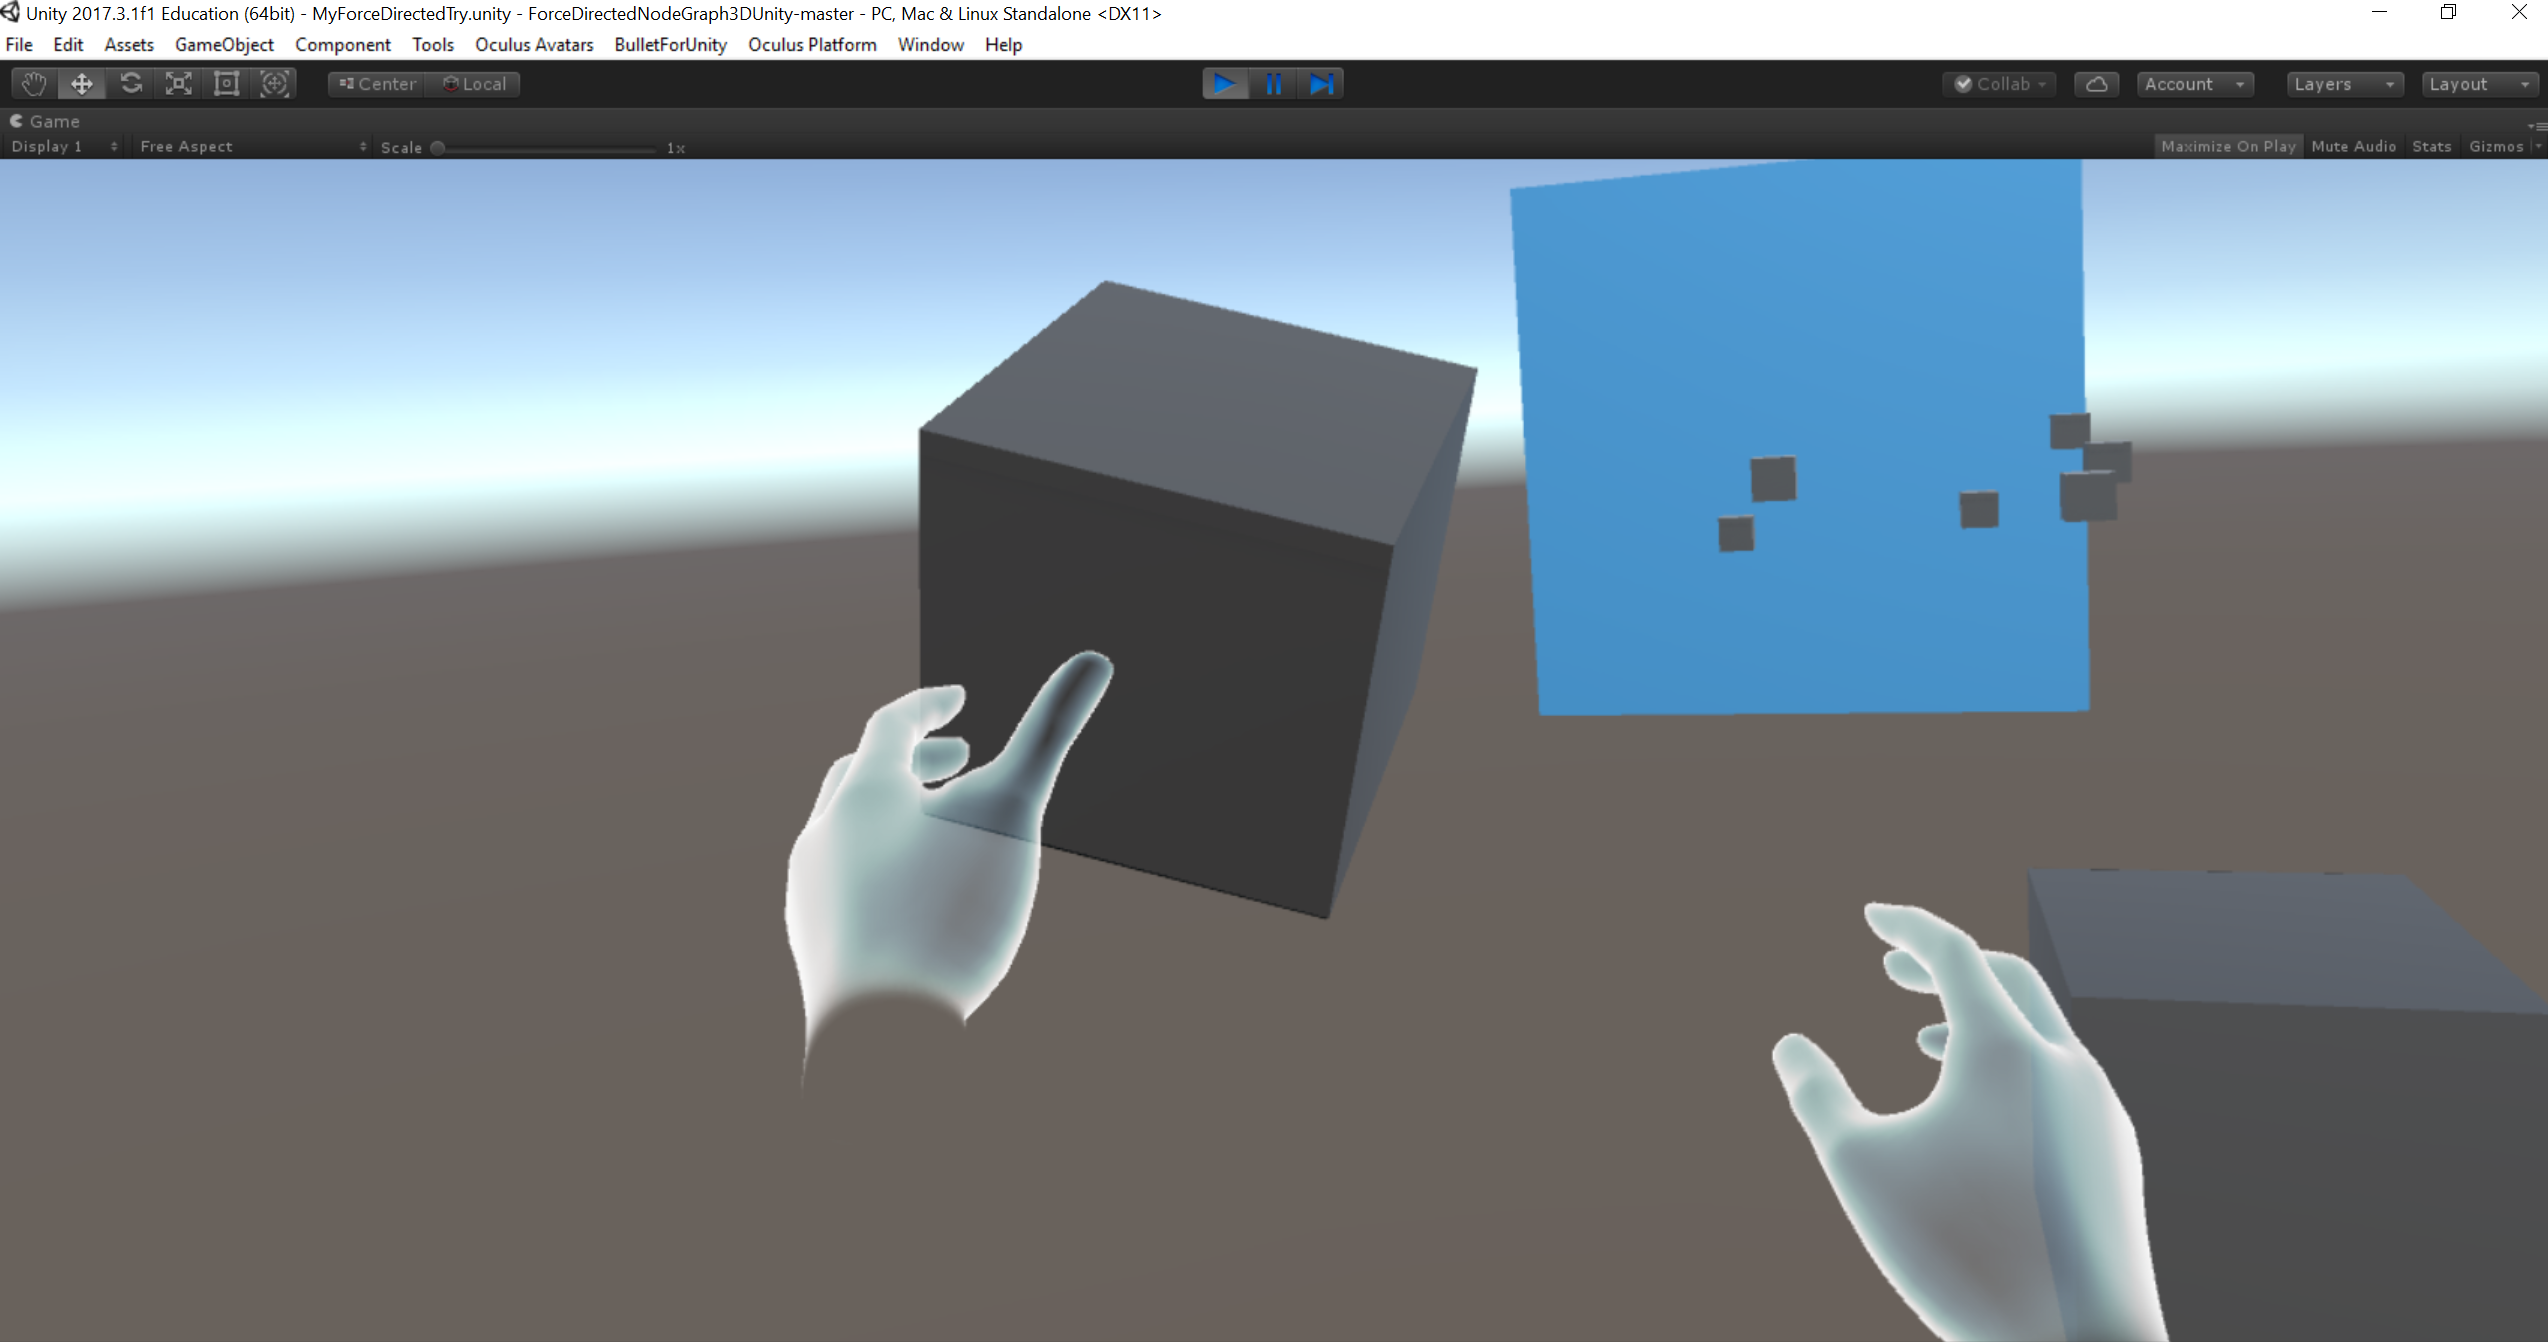
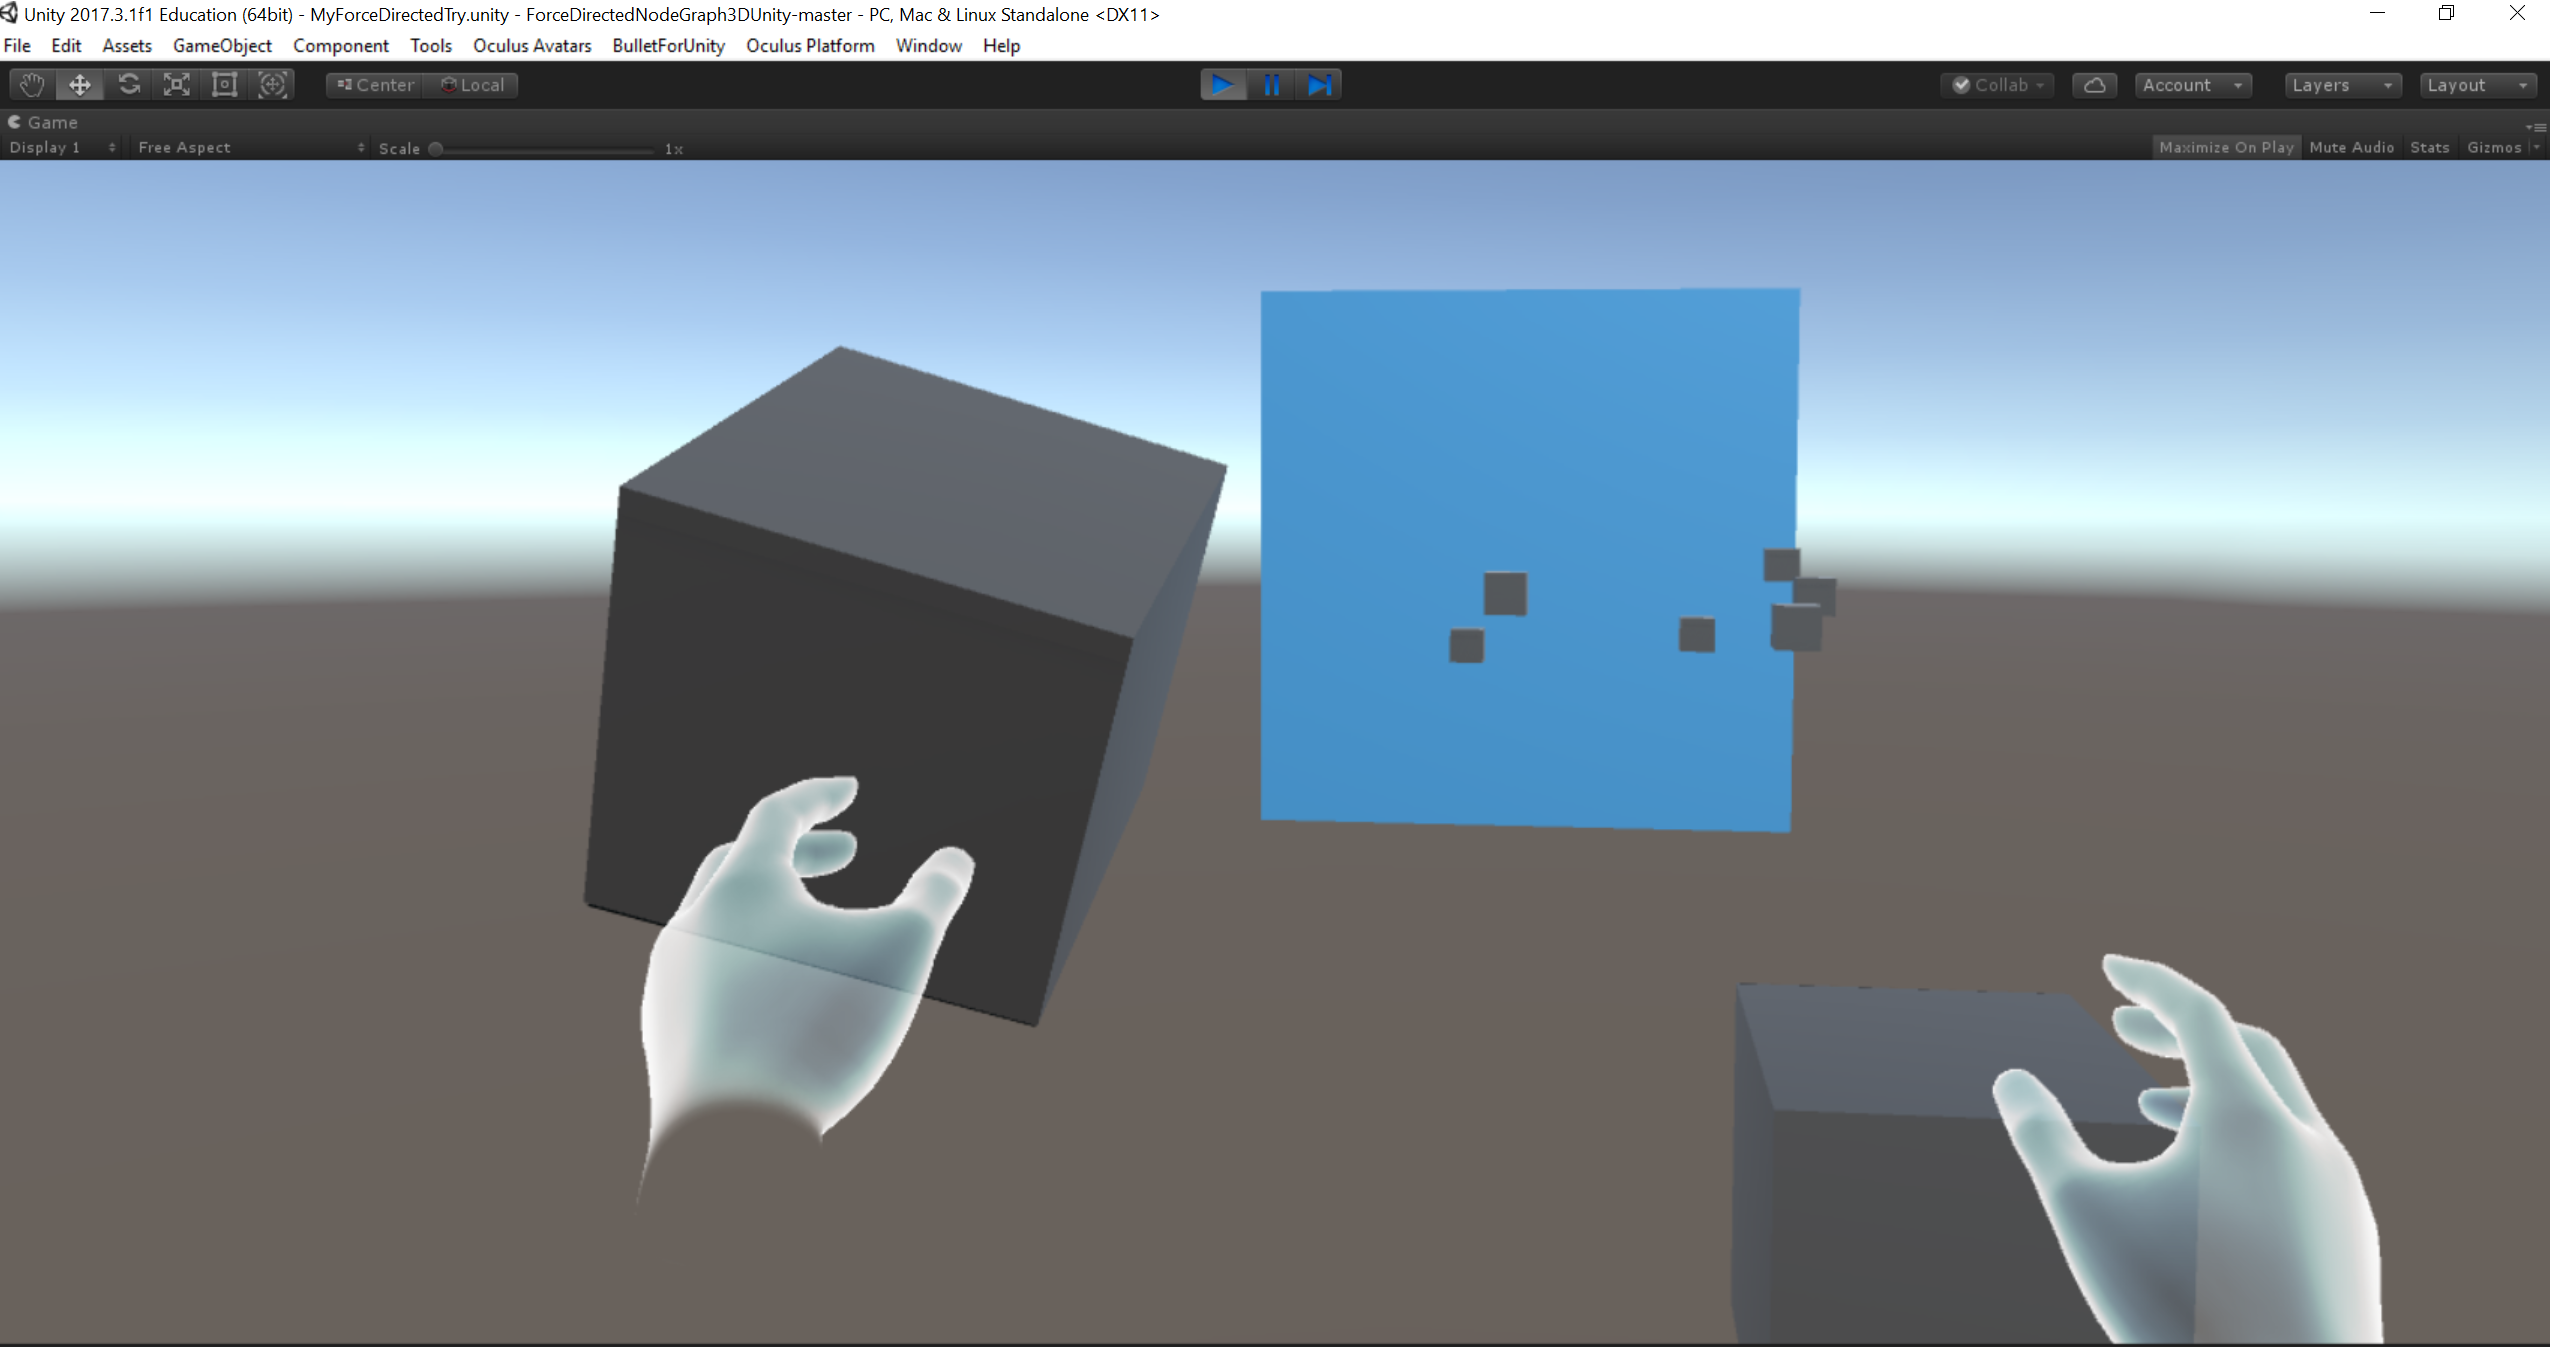
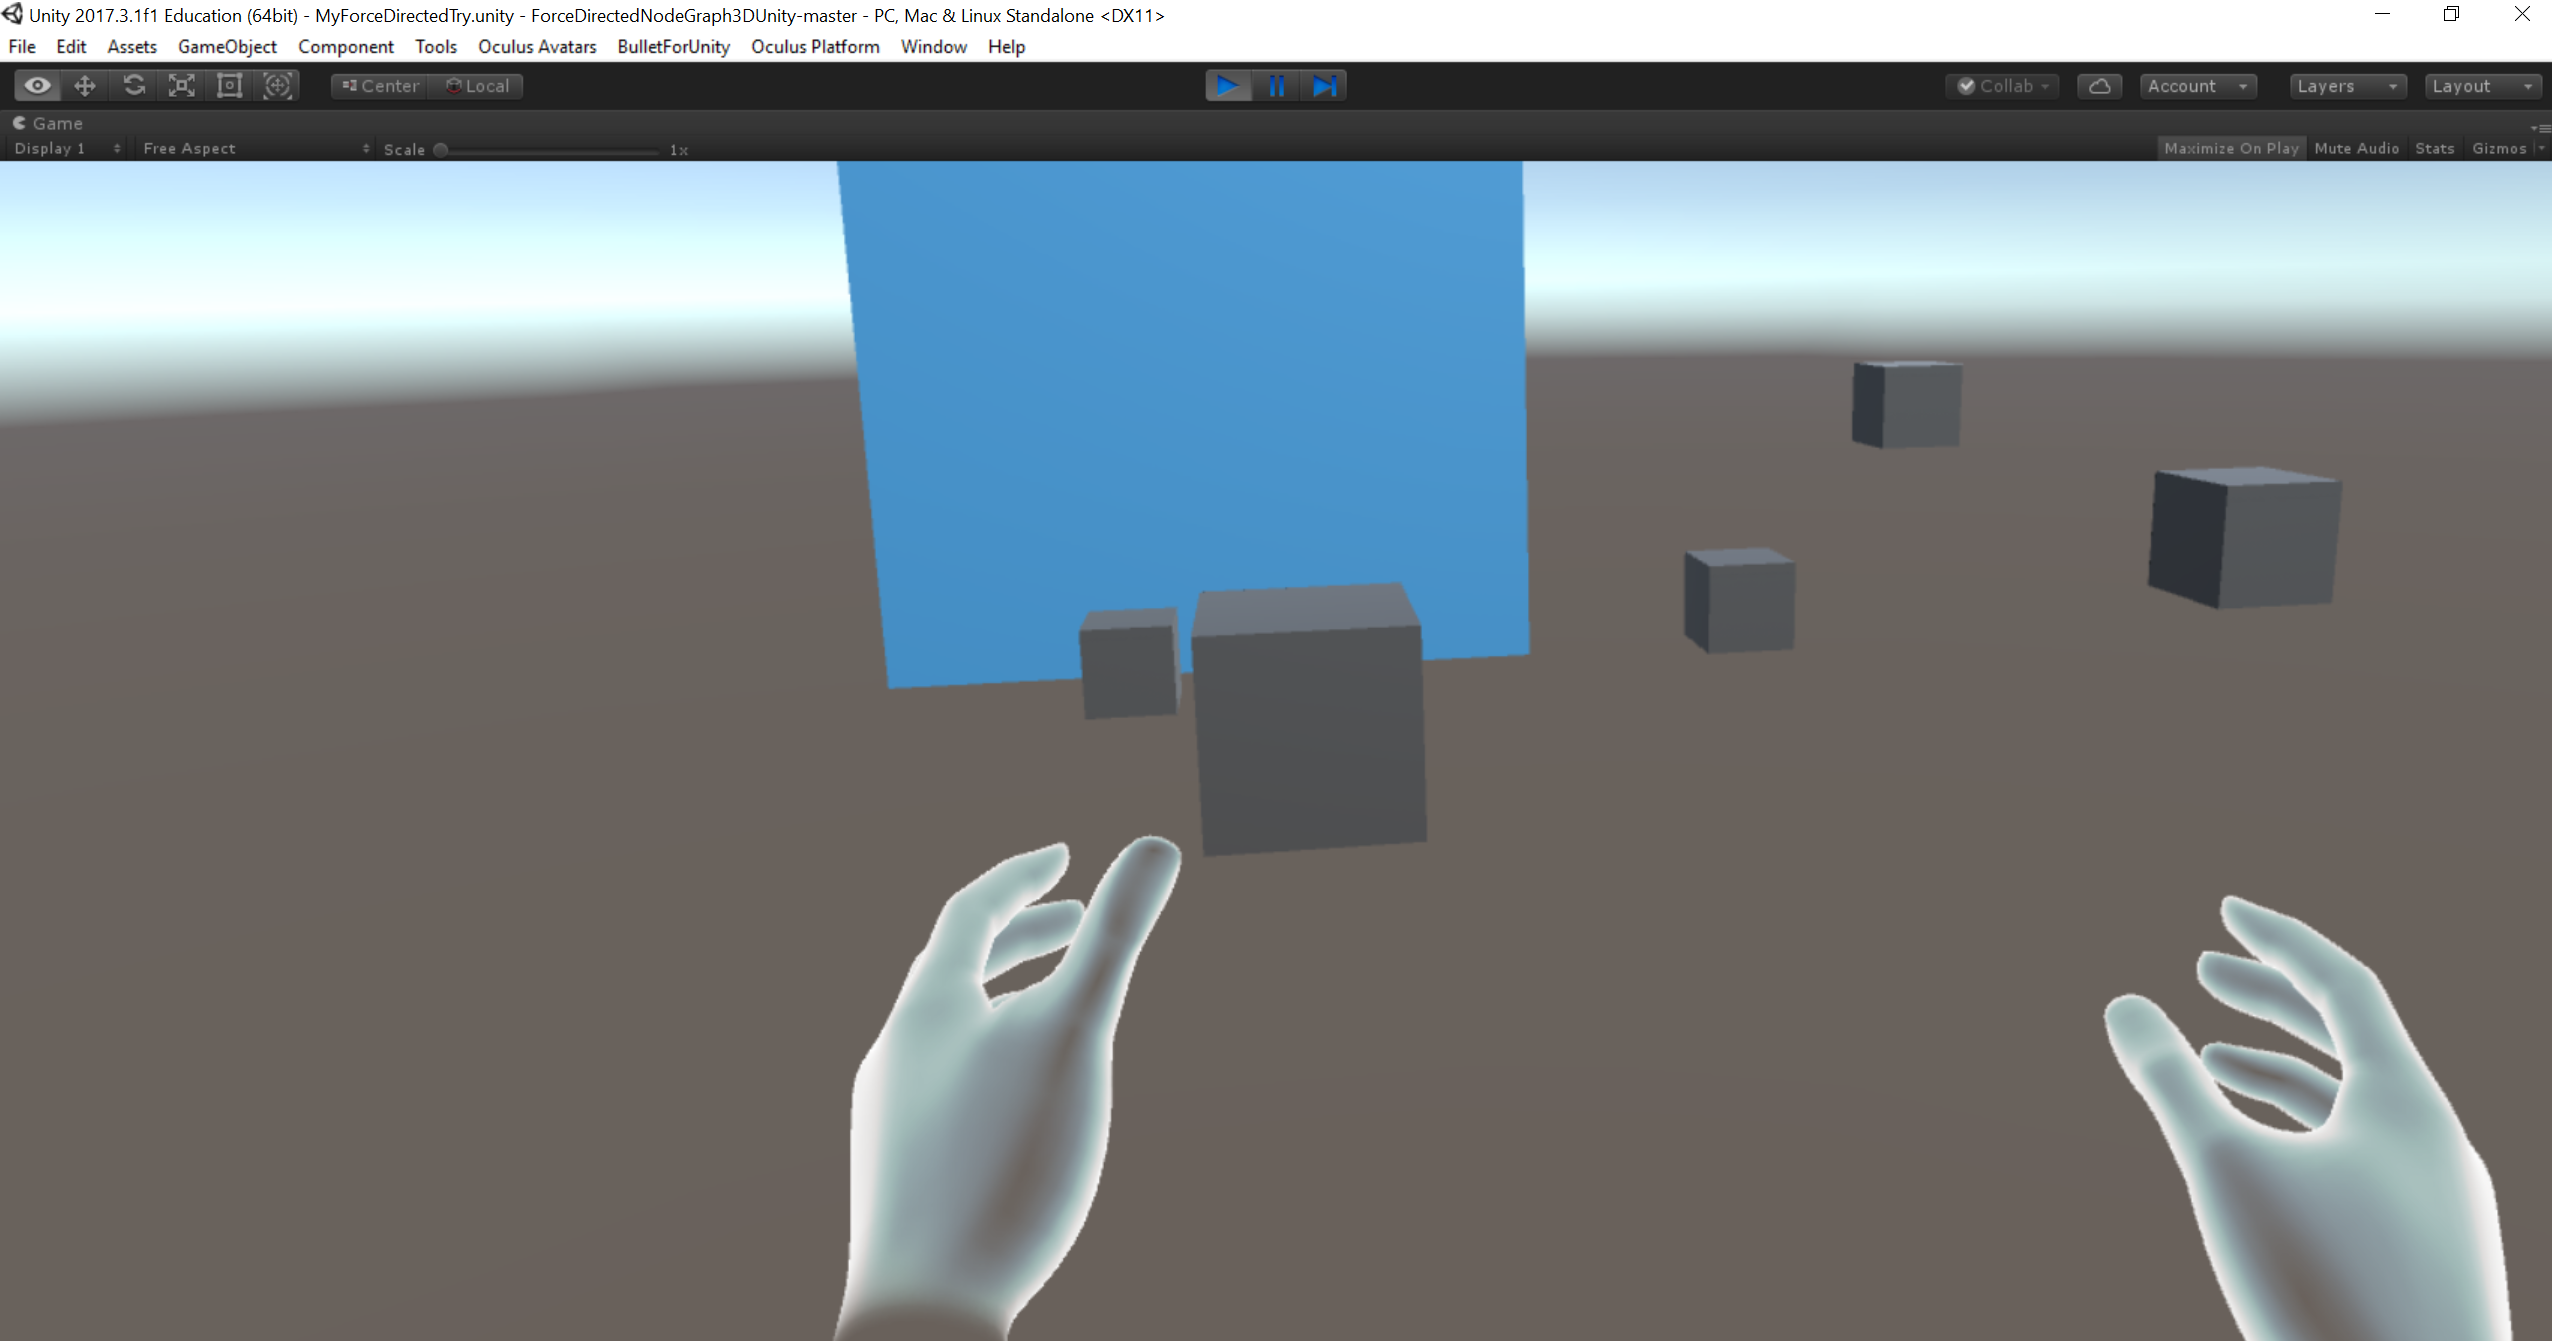
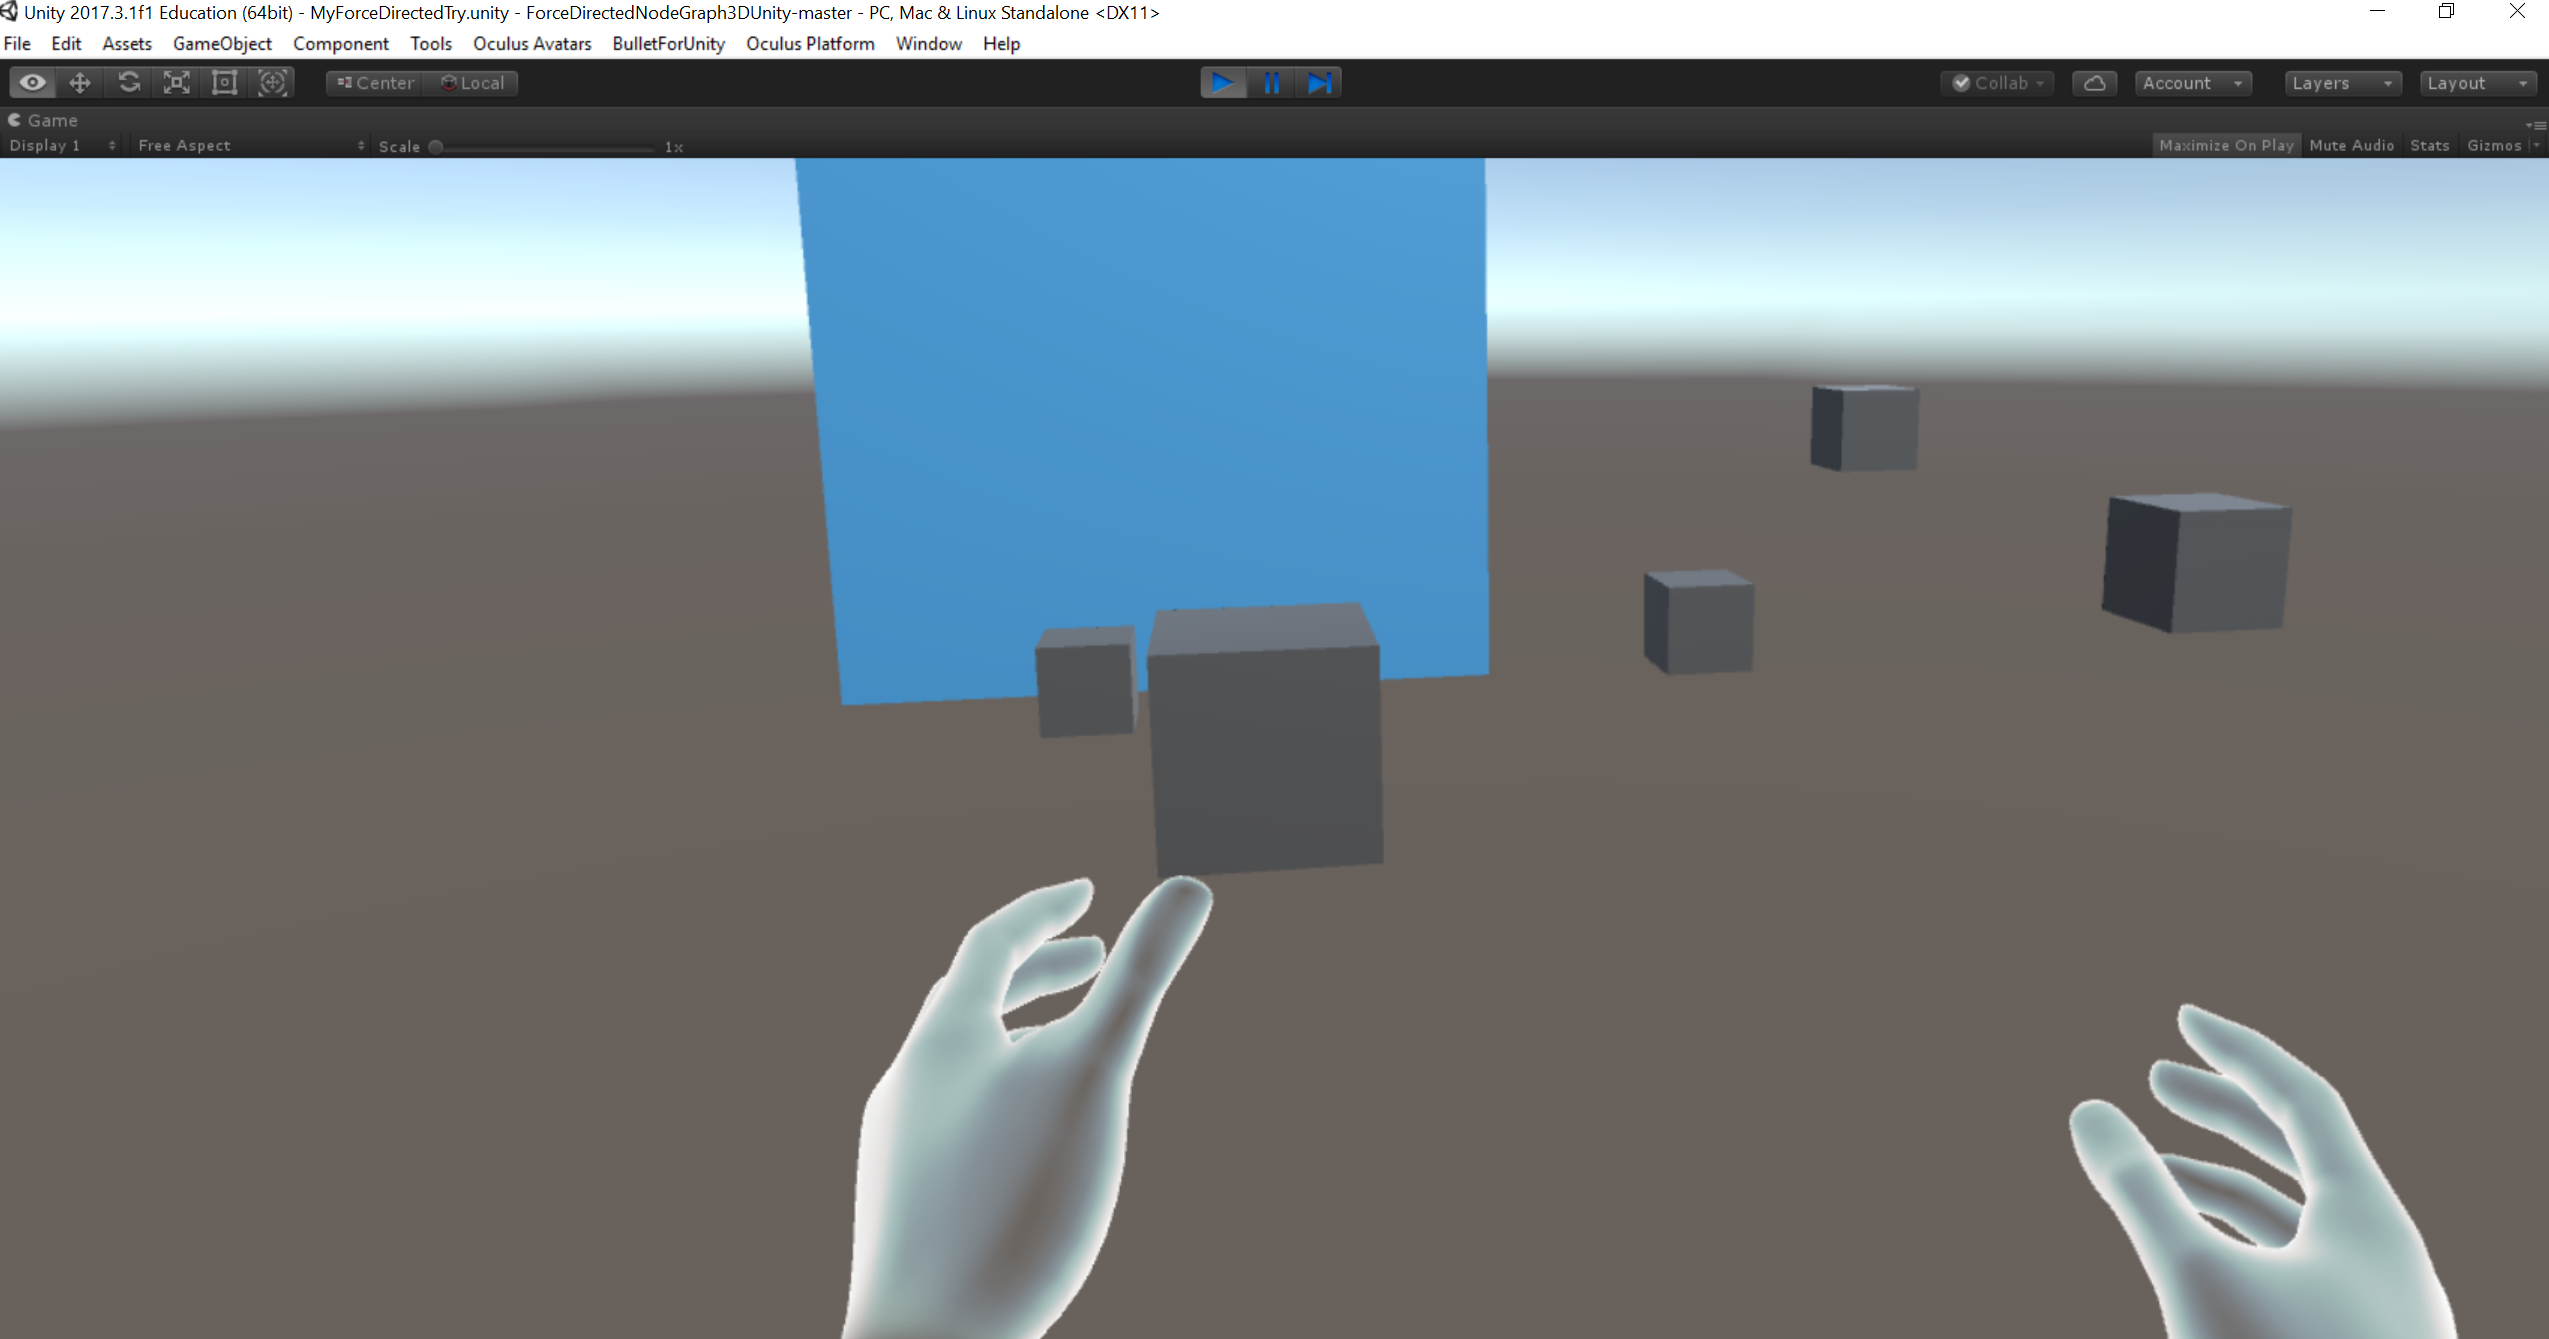
Immersive Visualization with Unity 3D and Oculus Rift
User grabing the data node using oculus rift touch controllers (Immersive VR)
User grabing the data node using oculus rift touch controllers
