Scientific Data Visualization of COVID-19 Data and Baltimore Crime Data
Students: Tyren Walker, Sean Walker, Taylor Brown, Brianna Young, Joevaughn Findlay, Andrei Carillo (Undergraduate), Adrian Brown (Undergraduate), and Trisha Rayan, TJHSST (Thomas Jefferson HS for Science Technology)
Status: Current
Funded by the National Science Foundation 2019-2022 (Award #1923986)
Crime and COVID-19 Data Visualization in Baltimore
The goal of this project is to find common links between COVID-19 data and its relationships with crime data in Baltimore. The aim of the project is to develop scientific data visualization using Paraview, Power BI, DXR, and Unity 3D. Advances in new technologies such as machine learning, virtual reality, augmented reality, and mixed reality have given rise to immersive field of immersive analytics, which investigates how these new technologies support analysis and decision making. We are exploring data sets for location information of crimes that have occurred in Baltimore City dating back to 2012. Human-centric situational awareness and immersive analytics are needed for analyzing the big data in an efficient way. The project aims to use virtual reality, augmented reality, and mixed reality techniques to visualize the data.
,
Data Visualization of Crime Data in Baltimore using Immersive VR
Data visualization of COVID-19 & Baltimore crime data using Unity 3D
COVID-19 data and Baltimore crime data using Power BI and Tableau.
Data Visualization of crime data in Baltimore using Unity 3D
Healthcare Data Visualization of COVID-19 using Power BI
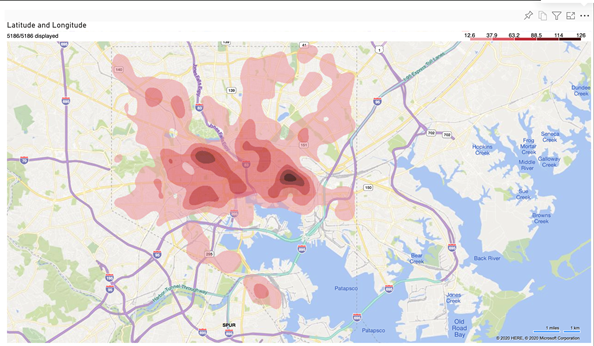
Heat map of Crime Frequency in Baltimore. The heat map uses data from March 12, 2020. The more intense shades of red means a higher number of crimes committed in that area.
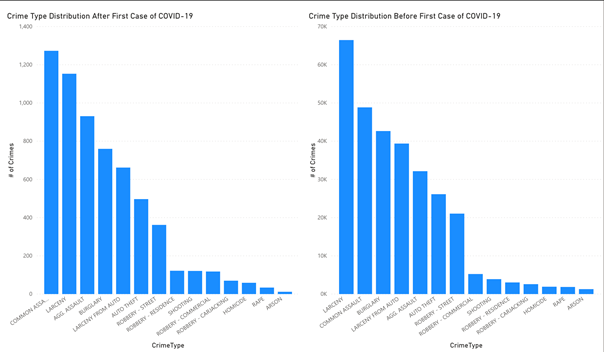
Crime Type Distribution Before and After First Case of COVID-19: These two bar charts show the frequency of different crime types before and after March 12,2020.
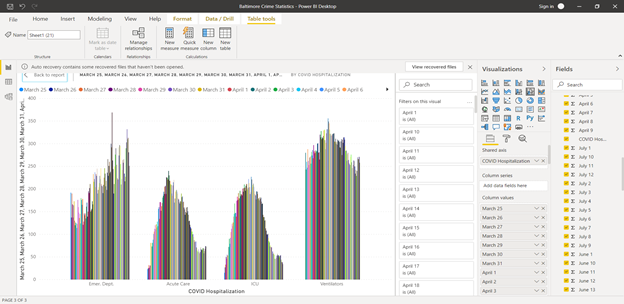
Hospitalization: At its highest peak, there were 227 COVID patients in the ICU with the bed utilization at 86% and 92 beds available on May 14. As of July 12, there are 34 COVID patients in ICU with bed utilization still at 86% and 76 beds available. Emergency Department: On June 10, Baltimore Eds saw their most COVID-related cases with 369 patients. As of July 12, there were only 251 COVID-related patients in the ED. Ventilators: The highest daily peak for ventilator usage was seen on May 14 with 356 ventilators being used.
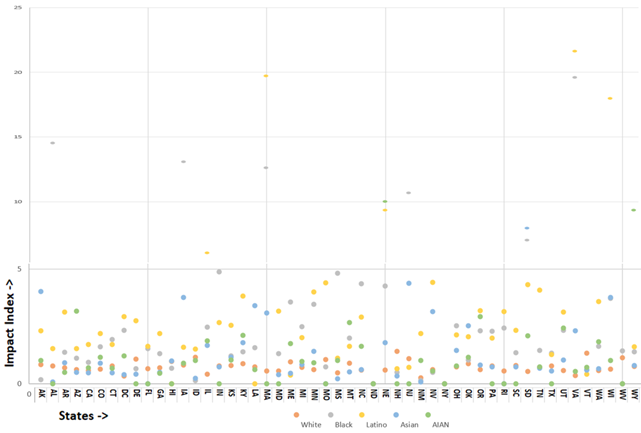
COVD-19 Cases Impact Index by Demographics in US States (as of 26-Jul-2020) (Index=1 means same impact to all race, <1 means less impact to that race, >1 means higher impact to that race): This graph shows the impact of COVID-19 on various races by the state in the US. It displays the infection and death rates by the proportion of each respective race’s population, rather than the total population. The impact index is calculated by dividing the percent population of infected people by the percent of the total population that the particular race makes up, and the same is done with the deaths statistics.
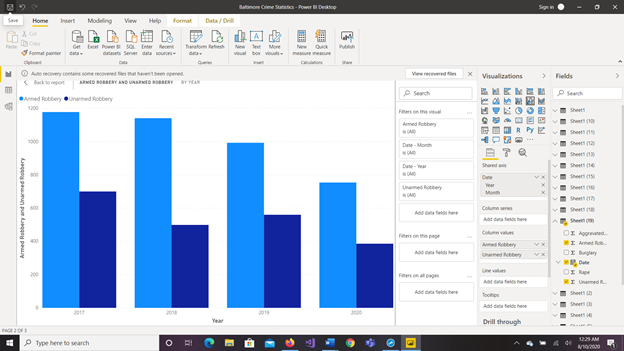
Robberies in Baltimore were tracked in two ways: armed and unarmed. In each of those four categories, armed robberies were higher and took into account various types of weapons, be they firearms, knives, or other objects.
COVID-19: As of 7/12/2020, there are 73,109 confirmed cases in the state of Maryland and 3,188 deaths confirmed to be caused by COVID-19. In Baltimore, the number of confirmed cases is 8,569 and the number of COVID deaths is 349. This means that Baltimore contains 12% of the positive cases and accounts for 11% of the coronavirus deaths.
Crime Type: animation shows the comparison for the different types of crimes. The height and color of the point shows the frequency of the crime.
Weapon Type: animation shows the comparison for the different types of weapons used for crimes*. The height and color of the point shows the frequency of the weapon being used.
Publications
Sharma, S., Reehl, A., " Data Visualization of Crime Data using Immersive Virtual Reality Proceedings of the IS&T International Symposium on Electronic Imaging (EI 2022), in the Engineering Reality of Virtual Reality, Burlingame, California, January 16-20, 2022. (Accepted)
Sharma, S, Bodempudi S.T., Reehl A., "Real-Time Data Analytics of COVID Pandemic Using Virtual Reality", In: Chen J.Y.C., Fragomeni G. (eds) Virtual, Augmented and Mixed Reality. HCII 2021. Lecture Notes in Computer Science, vol 12770. Springer, Cham, https://doi.org/10.1007/978-3-030-77599-5_9, 2021.
Walker, T, Sharma, S.," Data Analysis of Crime and Rates of Hospitalization due to COVID-19, Proceeding of the IEEE International Conference on Computational Science and Computational Intelligence, (CSCI'21),Symposium of Big Data and Data Science (CSCI-ISBD), Las Vegas, USA, December 15-17, 2021.
Walker, S., Sharma, S.," Data Visualization of Covid-19 and Crime Data, Proceeding of the IEEE International Conference on Computational Science and Computational Intelligence, (CSCI'21), Symposium of Big Data and Data Science (CSCI-ISBD), Las Vegas, USA, December 15-17, 2021.
Sharma, S., Bodempudi, S.T., Reehl, A. " Real-time Data Analytics of COVID Pandemic using Virtual Reality, Proceedings of the 23rd International Conference on Human-Computer Interaction (HCI International 2021), Thematic Area: Virtual, Augmented and Mixed Reality, J. Y. C. Chen and G. Fragomeni (Eds.): HCII 2021, LNCS 12770, pp. 106-116, Washington DC, 24-29 July 2021.
Sharma, S, Bodempudi, S.T., Reehl, A. " Real-Time Data Visualization to Enhance Situational Awareness of COVID pandemic ", Proceeding of the IEEE International Conference on Computational Science and Computational Intelligence (CSCI'20), Las Vegas, Nevada, USA, DOI: 10.1109/CSCI51800.2020.00066, Dec 16-18, 2020.
Rayan, T., Brown,A., Carillo, A., Sharma, S, " The Effect of COVID-19 on Various Racial Demograpics in the United States ", Proceeding of the IEEE International Conference on Computational Science and Computational Intelligence (CSCI'20), Las Vegas, Nevada, USA, Dec 16-18, DOI: 10.1109/CSCI51800.2020.00068, ISBN:978-1-7281-7624-6, 2020.
Bodempudi, S.T., Sharma, S, Sahu, A, "Human-Centric Situational Awareness and Big Data Visualization", Proceeding of 28th International Conference on Software Engineering and Data Engineering (SEDE 2019) in San Diego, CA, USA on September 30 - October 2, 2019.